Tag Archives: marketsmuse

Mr Robot: Tom Dorsey’s ETF Uses Computers To Outperform Humans

MarketMuse update is courtesy of BloombergBusiness’s Anthony Effinger and Eric Balchunas’s 15 March article, “Funds Run by Robots Now Account for $400 Billion” profiles self proclaimed money manager, Tom Dorsey’s key to  a successful portfolio just takes pressing a button. 

Few people have profited more from the so-called smart-beta craze than Tom Dorsey. A new exchange-traded fund that he runs using a century-old charting methods took in $1.2 billion last year. Then, in January, he sold his 22-person investment firm, Dorsey, Wright & Associates, to Nasdaq OMX Group for $225 million.

Dorsey calls himself a money manager, Bloomberg Markets will report in its April issue, but his methods are more robot designer. He says so himself, proudly. If Dorsey and his team got abducted from their Richmond, Virginia, office by aliens, their algorithms could keep picking investments for the firm’s new money magnet, the First Trust Dorsey Wright Focus 5 ETF, forever.

“Once a quarter, we press a button,’’ Dorsey says. The Focus 5 algorithm then generates a list of investments, and First Trust Portfolios, his partner company, executes them. Otherwise, they don’t meddle with the robot. “We just need someone to press the button.’’

That, for Dorsey, is the essence of smart beta, or strategic beta, or scientific beta, or factor-based investing, or fundamental indexing, depending on which Ph.D. is talking. (Many smart-beta funds are designed by finance geeks.) It’s index investing with key twists, all of them rules-based, with no active management required. Most smart-beta funds track custom indexes. Some are simple variants of the Standard & Poor’s 500 Index and do what they say on the box. Others are hand-crafted and small batch, made by people with little more than a stock-filtering system and a dream.

For the entire article from BloombergBusiness, click here.

Investors Reach For Euro ETFs as the US Dollar Recovers

MarketMuse update courtesy of MarketWatch’s 12 March article, “Dollar surge has investors scrambling for a piece of this European ETF”. From the National Swiss Bank’s huge announcement in January to Greece’s continued demise, the European market has seen better days. While the US market continues to recover, the US dollar has almost completely recovered to the being equivalent with the Euro which is making investor grab at Euro ETFs. 

Back in 2008, $1.60 bought one euro EURUSD, -1.10% Fast forward to today, and the U.S. dollar is surging toward parity with the hobbled currency. Just a few more ticks to go.

Of course, the huge currency shake-up is bad news for U.S. exporters but it’s great for investors in the WisdomTree Europe Hedged Equity fund HEDJ, +0.19% And they are throwing gobs of money at it. Read: 4 stock plays that are attracting investor dollars this year.

In the past year alone, $12 billion has flowed into the fund, a more than tenfold increase. The ETF is now the biggest covering Europe with almost $14 billion in assets, according to ETF Database. That’s enough to displace the Vanguard FTSE Europe giant VGK, -0.85% as the region’s top dog.

Olly Ludwig, managing editor for ETF.com, points out that the dollar’s rise has turned a neutral investment into a world beater.

“There’s an elegant mirror-like quality to the chart that isolates the currency factor rather cleanly,” Ludwig said. “Were it not for the currency hedge, HEDJ would be about flat.”

Investors have obviously been taking notice, and currency-hedged ETFs, in general, have seen spikes in asset growth. Ludwig pointed out that, on Monday alone, HEDJ and the WisdomTree Japan Hedged Equity fund DXJ, -0.39% combined to attract $1 billion. In a single day.

For the entire article from MarketWatch, click here.

Following Slashing ETF Prices, State Street To Shutdown Three ETFs

MarketMuse update profiles the the second oldest financial institution in the United States, State Street’s plans to shut down three ETFs after what has been a very difficult year for them. The shutdowns are due to what they call “limited market demand”. With more of an update, an excerpt from InvestmentNews’ Trevor Hunnicutt’s story, “State Street to close three ETFs that attracted little investor interest” from 10 March , is below. 

The announced closure of the ETFs, including one municipal-bond fund in partnership with Nuveen Investments Inc., comes five weeks after the ETF pioneer slashed prices on nearly a third of its funds and while the firm faces outflows in its flagship fund.

State Street, who manages the first-to-market “SPDR” ETFs, will shut its S&P Mortgage Finance ETF (KME), S&P Small Cap Emerging Asia Pacific ETF (GMFS) and SPDR Nuveen S&P VRDO Municipal Bond ETF (VRD), according to a statement Monday. The funds are each at least three years old, but none hold more than $6 million in assets.

State Street, whose money managing arm is also known as SSGA, has $441 billion in U.S. ETF assets, third behind BlackRock Inc.’s iShares and the Vanguard Group Inc. The firm is perhaps best known for its SPDR S&P 500 ETF (SPY), which is commonly recognized as the first ETF traded in the U.S. as well as the most widely traded. That fund has lost $26 billion to investor redemptions this year, according to Morningstar Inc. estimates. State Street, whose index-tracking fund is used widely by tactical traders and institutions along with advisers, has said those flows are cyclical.

Meanwhile, the firm also has tried to expand its lineup to more profitable mutual funds and partnerships on ETFs with Nuveen and DoubleLine Capital’s Jeffrey Gundlach to attract assets into other product lines.

For the entire article from InvestmentNews, click here.

Trading Titan Point72 Gets to the Point: Big Data

MarketMuse update courtesy of Bloomberg Business profiles investment firm, Point72 Asset Management, expands its jobs to hire more employees in order to collect and analyze data. 

Steven Cohen’s investment firm is looking for an edge in public data.

Point72 Asset Management, the successor to Cohen’s hedge fund SAC Capital Advisors, has hired about 30 employees since the start of last year to build computer models that collect publicly available data and analyze it for patterns, according to two people with knowledge of the matter.

The hires are part of a project to expand quantitative investing, dubbed Aperio, that’s spearheaded by President Doug Haynes, said Mark Herr, a spokesman for the Stamford, Connecticut-based firm. Point72 is in the process of hiring a manager to oversee the strategy, he said, declining to comment on the number of professionals the firm has brought in so far.

Cohen, whose SAC Capital shut down last year and paid a record fine to settle charges of insider trading, joins Ray Dalio’s Bridgewater Associates in pushing into computer-driven investing, an area dominated by a handful of big firms such as the $25 billion Renaissance Technologies and the $24 billion Two Sigma. The money managers are seeking to take advantage of advances in computing power and data availability to analyze large amounts of information.

“Data used to come to you in a trickle and today it comes in torrents,” Herr said. “The amount of publicly accessible data can now be compared to a fire hose of information. People who can read the signals most accurately and analyze them are the ones who will generate returns.”

For the entire article, click here.

Global Macro Strategy: Get Short-y

MarketsMuse global macro strategy insight courtesy of extract from today’s a.m. edition of Rareview Macro LLC’s “Sight Beyond Sight”, which includes references to the following ETFs: EMB, HYG and LQD.. For those already subscribing to “SBS”, you already know that this market strategist incorporates a cross-asset model portfolio that has outperformed a significant number of those who oversee billions of dollars on behalf of the world’s most demanding investors.

Neil Azous, Rareview Macro

New Tactical Trade – Short German DAX…Model Portfolio -33% Net Short Equities

US Dollar Input – Not Just “Patient” and “QECB” but also Balance Sheet Management

Credit – Watch EMB, HYG, LQD Today

Model Portfolio Update – March 6, 2015 COB:  +1.04% WTD, +0.89% MTD, 0.00% YTD

This morning, in the model portfolio we sold short the German DAX. Specifically, we sold 200 GXH5 (DAX Mar15) at 11485. This is a short term directional trade. The notional equates to 20% of the NAV. The update was sent in real-time via Twitter.

All in, between the S&P 500 and DAX, the model portfolio is approximately-33% net short equities. To put it in simple terms, there is an opportunity right now to short the market. Why? Because, either the FOMC Committee blinks, and you get paid until they do, or they do not blink and you get paid as risk assets discount further interest rate normalization. Either way, your short position will make you money.

Here is the best way to describe our sentiment at the moment: Continue reading

Apple’s Latest Move Could Hurt Investors

MarketMuse blog update courtesy of InvestmentNews. With the anticipation of tech giant, Apple’s launch event today and last week’s announcement of  Apple joining the DOW, there is a lot to be excited about. However, InvestmentNews’ Jeff Benjamin points out how it could hurt investors. 

Investors and advisers who own shares of Apple Inc. (AAPL) cheered the news that it will soon be in the granddaddy of all stock indexes. But in all the hoopla, they may miss the fact that their portfolios could become overexposed to the tech giant.

On March 19, Apple is slated to replace AT&T Inc. (T) in the 119-year-old Dow Jones Industrial Average. The news sent Apple shares up $1.05, or 0.83%, to $127.46, in afternoon trading Friday as the Dow tumbled 1.44%.

As investible indexes go, the Dow is far from the most popular, but $12.5 billion of assets are invested in the SPDR Dow Jones Industrial Average ETF. And DIA soon will include the tech giant, joining the S&P 500 and a plethora of mutual funds and exchange-traded funds that already own it.

Apple, which started paying a dividend three years ago, is a Top 10 holding in a dozen dividend-focused ETFs that include Vanguard High Dividend Yield (VYM) and Wisdom Tree Total Dividend (DTD), as well as the Russell 1000 Index through iShares Russell 1000 (IWB) and iShares Russell 1000 Growth (IWF).

“There are probably some people who own the S&P and the Dow, and now they will own Apple in both indexes,” Mr. Rosenbluth said. “But, obviously, Apple is not the only stock held in multiple indexes.”

For the entire article from InvestmentNews, click here. 

Rate Outlook: This Fixed Income Expert Says: “Lower For Longer”

MarketsMuse update courtesy of debt capital markets desk notes distributed to clients of boutique brokerdealer Mischler Financial under the banner “Quigley’s Corner”. Mischler Financial, the financial industry’s oldest and largest minority firm owned/operated by Service-Disabled Veterans received the 2015 Wall Street Letter Award for Best Research/BrokerDealer.

Ron Quigley, Mischler Financial Group

Well, it’s finally Friday and every Friday is a Good Friday!  So, let’s take a look back at the amazing week the investment grade corporate debt market has just concluded.

  • This week was the second busiest in history for all-in IG volume (Corps+SSA) at $65.03b.
  • It is now the fourth busiest all-time as measured by the number of individual tranches priced for all-in IG Corporate plus SSA issues with 63tranches priced.
  • In terms of IG Corporate only supply the week’s  $54.03bn ranks 5th all-time in that category.
  • Market tone remains firm with CDX IG23 at a new low this morning of 60.12.
  • The DOW and S&P are hovering around all-times highs both set this past Monday.
  • Deals are performing well, NICs remain skimpy averaging 3.16 bps across this week’s 59 IG Corporate-only prints and demand is very strong with those 59 issues averaging a 3.55x bid-to-cover rate.
  • The U.S. NFP number was upbeat blowing by estimates or 295k vs. 235k and the EU will be purchasing assets launching EU QE as early as Monday’s session.
  • The average spread daily compression across today’s 59 IG Corporate-only new pricings was 16.28 bps from IPTs to the launch.
  • Spreads across the 4 IG asset classes are an average 21.00 bps wider versus their post-Crisis lows and versus 23.50 last Friday or 2.50 bps tighter on the week!
  • Spreads across the 19 major industry sectors are an average 25.32 bps wider versus their post-Crisis lows and versus 28.21 bps last Friday or 2.89 bps tighter!
  • BAML’s IG Master Index was unchanged at +131 versus yesterday but 6 bps tighter versus last Friday’s +137 although rebalancing took place thanks to Petrobras being dropped due its high yield rating.
  • Standard & Poor’s Global Fixed Income Research was at +171 versus +173 one week ago or 2 bps tighter.
  • Taking a look at the secondary trading performance of this week’s IG and SSA new issues, of the 63 deals that printed, 51 tightened versus NIP for a 81.00% improvement rate while only 4 widened (6.50%), 7 were trading flat (11.00%) and 1 was not available (1.50%).

Continue reading

This Way To Emerging Market Debt..Global Macro Opinion

MarketsMuse fixed income and global macro update courtesy of extract from blog post at II’s blog by James Craige, the head of emerging-markets debt at Stone Harbor Investment Partners in New York.

Two years of challenged returns, and high volatility, by emerging-markets local currency debt has prompted questions from investors. Is emerging-markets local currency debt still a valid asset class? How will factors such as lower commodities prices and changes in the U.S. Federal Reserve’s policy rate affect such debt? What is its market outlook? These are sound concerns, to be sure. But none of them alter our view that the asset class remains as legitimate as ever.

Craige_Jim_250Multiple factors, including weaker-than-expected growth, capital outflows, heightened foreign exchange volatility and geopolitical tensions, have contributed to the poor performance of local currency–denominated emerging-markets debt — particularly the forex component of returns. The halving of the market price of oil in the second half of 2014 created further concerns. We believe, however, that this constellation of factors is unlikely to reoccur in the same way or with the same intensity. At current valuations, emerging-markets local currency bonds are set to outperform other fixed-income segments.

Read who, why and how (to leverage this view point) via the full blog post at Institutional Investor

Corporate Bond ETFs and Liquidity: A Looming Black Swan or Extended Contango?

MarketsMuse update inspired by yesterday’s column by Tom Lydon/ETFtrends.com and smacks at the heart of what certain “bomb throwers” believe could be a Black Swan event, albeit an event that may not be driven by a global crisis or surprise economic event. The event in question will, in theory, take place when interest rates start ticking up (and underlying corporate bond prices tick down) and institutional bond fund managers find themselves trying to figure out whether to simply suffer from mark-downs (and performance) or to continue collecting coupons until the issues they hold mature.

MM Editor Note: Since most folks know that bond managers are akin to lemmings (no disrespect intended!) and typically follow each other like blind mice, given the massive size of the corporate market place, a potential avalanche could take place when everyone runs for the exit if rates tick up and simultaneously, the economy starts to slow. Wall Street dealers are certainly not going to be available to catch those falling knives, simply because new regulations have put a crimp in the capital they can commit to warehousing positions. Worse still, its easy to envision one very long contango event, where the cash ETF trades at a discount to the value of the underlying bonds, simply because one won’t be able to sell those underlying bonds in any type of material size.

Here’s an opening extract from Tom Lydon’s piece “Liquidity Concerns In Corporate Bond ETFs”: Continue reading

Take A Drag Or Sip Out Of These Industries: Smoke and Alcohol ETFs Are Hot

MarketMuse update is courtesy of Bloomberg’s Justin Fox. It is very difficult to invest stocks for long term, humans’ interests are always changing and that affects the stock market. Bloomberg’s Justin Fox suggests that people should invest in human behaviors such as the tobacco and alcohol industries, such as the tobacco sector big name, Philip Morris International Inc., PM or popular alcohol ETF,  Constellation Brands Inc., STZ. He explains that unless these products are banned, humans will always have an interest.

It would be really cool to know which industries are going to thrive and grow and create jobs in the future. It’s also really hard to figure that out ahead of time. If you’re just interested in which industries will deliver the best stock-market returns, though, history seems to point to an easy shortcut — invest in companies that sell addictive stuff.

I learned this dubious lesson by reading, in quick succession, two big new reports: the Brookings Institution’s analysis of the 50 “Advanced Industries” that are supposed to drive job and income growth in the U.S., and Credit Suisse’s annual “Global Investment Returns Yearbook.” The Brookings report tries to look into the future by measuring investment in technological progress by industry — and although most of the 50 advanced industries it identifies are what you would expect, there are some surprises. In the 2015 Credit Suisse yearbook, meanwhile, Elroy Dimson, Paul Marsh and Mike Staunton of London Business School examine 115 years of stock-market returns by industry, and while they document a lot of technological upheaval, the two biggest winners for investors turn out to be decidedly low tech.

An advanced industry, by Brookings’ accounting, is one “in which R&D spending per worker reaches the top 20 percent of all industries and the share of workers with significant STEM knowledge exceeds the national average.” (STEM = science, technology, engineering and math. And R&D = research and development. But you probably knew that.) There’s lots of research showing that technological change drives economic growth, and R&D spending and STEM knowledge are supposed to be proxies for future technological change.

I don’t know of any obviously better proxies, but the results show the difficulty of any such accounting. The list of the very biggest R&D spenders isn’t particularly surprising:-1x-1
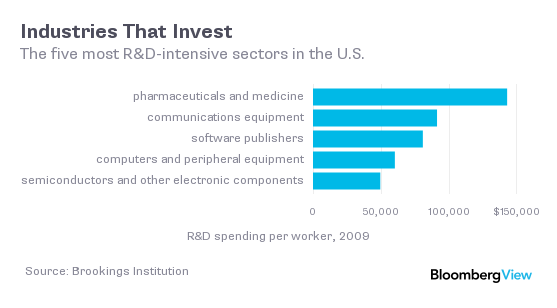
Dig deeper into the advanced industries list, though, and you soon come across industries that don’t seem all that advanced: railroad rolling stock, foundries, petroleum and coal products, metal-ore mining. Are these secret hotbeds of technological change that should command more attention? Probably not. One old-school industry, motor-vehicle manufacturing, does spend a ton on R&D ($48,461 per worker), but those others made the list mainly because there just aren’t that many industries in the U.S. that invest in R&D at all. To get to 50, you have to include a bunch of industries with per-worker spending of less than $5,000 a year. (No. 50, in case you’re wondering, is wireless-telecommunication carriers — which spent just $455 per worker in 2009.)

This isn’t necessarily a problem for the U.S. economy. One thing you’ll notice if you spend any time with the North American Industry Classification System is that it’s backward-looking. Older parts of the economy are divided into lots and lots of industries; newer ones aren’t. So you get railroad rolling-stock manufacturing, which employed 25,200 people in 2013 and generated $3.6 billion in output, counted as an industry on the same level as computer-systems design, which employed 1.7 million people and generated $246 billion.

Yet it’s these newer industries that generate the growth — at least, they have over the past 115 years. In 1900, according to the Credit Suisse yearbook, railroads accounted for 63 percent of stock-market value in the U.S. Now they’re less than 1 percent, and 62 percent of U.S. stock-market value is in industries that were small or nonexistent in 1900. The largest industries by market cap now are technology, oil and gas, banking and health care.

We’re all supposed to believe that past performance is no guarantee of future results. But given human nature, it seems reasonable to expect tobacco and alcohol to continue to do well — unless tobacco is completely banned, of course. Picking the next hot industry is a much harder task, yet it is a much more important one.

For the entire article, click here.


German ETFs Offer Good Opportunities in Rebounding European Market

MarketMuse update is courtesy of ETF Trends’ Todd Shriber.

Earlier this week and over the past few months, MarketMuse has been covering the rocky European market, thanks to Greece, and its recent rebound, with ETF $GVAL. Now investors have even more to be excited about with the recent success of German ETFs. 

The U.S. is not the only developed market where stocks are eying record highs. Germany’s benchmark DAX accomplished that feat Friday, climbing above 11,000 for the first time.

Exchange traded fund investors are responding, pumping massive of amounts of capital into Germany ETFs. The Recon Capital DAX Germany ETF (NasdaqGM:DAX), the only U.S.-listed DAX-tracking ETF, is up nearly 8% in the past month.

With its heavy tilt toward large, multi-national companies, the DAX index is benefiting from a depreciating euro currency. A weaker euro would help support export growth and potentially generate greater revenue from overseas operations for the multi-nationals.

A weak euro and sturdy data out of the Eurozone’s largest economy is prompting investors to put new capital to work with Germany ETFs. Through Thursday, only three ETFs have seen greater inflows than the $494.1 million added to the iShares MSCI Germany ETF (NYSEArca: EWG), the largest Germany ETF.

One of those three is the WisdomTree Europe Hedged Equity Fund (NYSEArca:HEDJ), which allocates 26% of its weight to German stocks. No ETF has seen larger 2015 inflows than HEDJ’s $4.1 billion in new assets and the gap between HEDJ and the second-place inflows ETF, the SPDR Gold Shares (NYSEArca: GLD), is sizable at over $1.6 billion.

Thanks to the faltering euro, investors are also flocking to currency hedged Germany ETFs. After taking in $450 million on Thursday, the iShares Currency Hedged MSCI Germany ETF (NYSEArca: HEWG) has added over $491 million this week. The ETF, which uses EWG with a EUR/USD hedge, had $287.4 million in assets heading into Thursday.

On a percentage basis, the Deutsche X-trackers MSCI Germany Hedged Equity Fund (NYSEArca: DBGR) and the WisdomTree Germany Hedged Equity Fund (NasdaqGM: DXGE) have also seen significant asset growth. DXGE has more than doubled in size this year while DBGR has tripled in size since the start of 2014.

Underscoring the advantage of the euro hedge with German equities, DBGR and DXGE have both produced double-digit returns over the past month while EWG is up “just” 7.5%. Importantly, economic data supports the case for more upside for Germany ETFs,

“German gross domestic product expanded 0.7 percent in the fourth quarter, soaring past an estimate for 0.3 percent. Private consumption rose markedly in the fourth quarter, and investment developed positively, driven by a significant increase in construction output,” reports Inyoung Hwang for Bloomberg.


Take A Bite Out of This Apple: Tech ETF Surges Off Of Apple’s Success

MarketMuse update is courtesy of ETF Trends’ Tom Lydon

Shares of Apple (NasdaqGS: AAPL) are up a modest by the stock’s standards 0.6% today, pushing the iPhone maker’s market capitalization to a lofty $732 billion and some change.

As has been well-documented, Apple’s ascent to becoming the first company with a market value of $700 billion and its targeting of the unheard of $1 trillion stratosphere is benefiting plenty of exchange traded funds. One of those ETFs is the Fidelity MSCI Information Technology Index ETF (NYSEArca: FTEC).

FTEC is one of the newer kids on the sector ETF block, having debuted in October 2013 as part of Fidelity’s 10-ETF sector suite. That group has since grown by one with the recent addition of theFidelity MSCI Real Estate Index ETF (NYSEArca: FREL).

Fidelity has navigated the ultra-competitive sector ETF landscape with success. In June 2014, Fidelity’s original 10 sector ETFs had a combined $1 billion in assets under management, a number that has since more than doubled to $2.2 billion.

FTEC has been a primary driver of Fidelity’s sector ETF growth. At the end of January, the ETF had $352.6 million in assets under management, good for the second-best total among Fidelity sector ETFs behind the Fidelity MSCI Health Care Index ETF (NYSEArca: FHLC).

In an environment where Apple has more than restored its juggernaut status, FTEC earns its place in the Apple ETF conversation with a weight of 17.1% to the iPad maker. That is more than double FTEC’s weight to Microsoft (NasdaqGS: MSFT), its second-largest holding.

FTEC’s Apple weight of 17.1% also exceeds the weight to that stock found in one of the fund’s primary rivals, the Vanguard Information Technology ETF (NYSEArca: VGT).Unlike rival ETF issuers, Vanguard does not update its funds’ holdings on a daily basis, opting to do so once a month. VGT’s latest holdings update, from Dec. 31, 2014, showsan Apple weight of 15.3%. With the stock’s 14.5% gain this year, VGT’s Apple exposure is now likely well over 16%.

FTEC and VGT compete for the affections of cost-conscious investors as both charge just 0.12% per year, making the pair the least expensive tech sector ETFs on the market. Each has returned 2.1% year-to-date.

Like its rivals, FTEC is a cap-weighted ETF, meaning as Apple’s market value rises, the stock’s presence in FTEC grows. Since the start of December, FTEC’s Apple weight has increased by 140 basis points.

“FTEC offers more exposure to semiconductors and data processing & outsourced services companies and no exposure to integrated telecom services stocks,” according to S&P Capital IQ, which rates the ETF overweight.

Will Investors Buy Into The Latest Buyback ETF? A Look at $SPYB

MarketsMuse update profiles last week’s launch of the SPDR S&P Buyback ETF, an exchange-traded fund focused on tracking the stock price performance of companies that are in midst of corporate share repurchase (10b-18) programs. Excerpt courtesy of ETF Daily News.

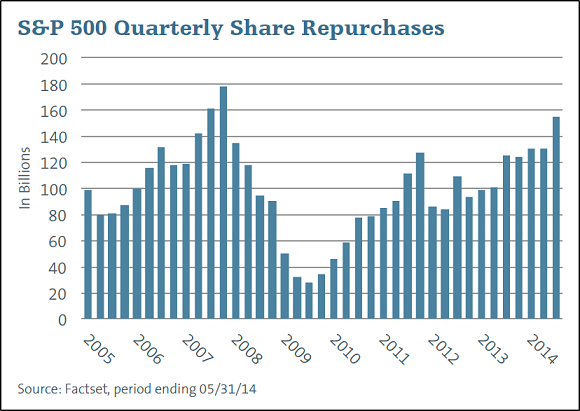
Buybacks and dividends have been among the primary contributors to the stock market Bull Run. In fact, share buybacks in the third quarter amounted to $143.4 billion – the fourth highest quarter for spending on buybacks by S&P 500 companies since 2005.

This massive surge in spending by U.S. companies on share buybacks has prompted issuers for launching new products targeting this space. State Street has recently launched a product that would tap companies having a high buyback ratio.

The product – SPDR S&P 500 Buyback ETF – was launched on February 4 and trades under the ticker SPYB. Below we have highlighted some of the details about the newly launched fund.

SPYB in Focus

The ETF looks to track the performance of the S&P 500 Buyback Index, which provides exposure to 101 companies in the S&P 500 with the highest buyback ratio in the last 12 months. The index follows an equal weighted strategy and is rebalanced quarterly. The equal weighted strategy ensures that the index’s assets are quite well diversified with none of the individual holdings having more than 1.2% exposure in the fund.

Tesoro Corporation, Kohl’s Corporation and MeadWestvaco Corporation    are the top three holdings of the fund. Sector-wise, Consumer Discretionary takes the top spot with a little less than one-fourth of fund assets, followed by Technology and Industrials with 18.2% and 16.3% exposure each..

The index currently has a dividend yield of 1.47%, while the fund charges 35 basis points as fees.

How does it fit in a portfolio?

Though most investors prefer dividends to buybacks as they allow investors to get the cash immediately, a buyback has its own set of advantages. Buybacks reduce the outstanding share count and thus increase earnings per share. Further, they are more tax efficient than a special dividend.

Per Fact Sheet, U.S. share buyback increased 16% year over year and 6.6% quarter over quarter during the third quarter of 2014. Moreover, U.S. companies are currently sitting on a record amount of cash, which might encourage the companies to continue to be active on the share buyback front.

For the entire story from ETF Daily News, please click here

Catch Europe’s Rebound With $GVAL ETF

MarketMuse update profiling Europe’s market rebounding is courtesy of ETF Trends’ Tom Lydon

With Greece seemingly in the headlines every day, and rarely with good news, it is easy for investors to perceive European equities as damaged and vulnerable to more declines.

On the brighter side of the ledger, history is littered with examples that highlight the profitability of contrarian investing and buying when others are fearful. Enter the Cambria Global Value ETF (NYSEArca: GVAL).

GVAL debuted in March to 2014 and to say the ETF was the victim of inauspicious timing is to understate matters. While an ideal way to gain access to some attractively valued developed European markets, GVAL also features ample emerging markets exposure. Neither emerging nor non-U.S. developed markets were the places to be soon after GVAL debuted.

“GVAL has gotten off to a humble start. But if you’re a believer in value investing as a discipline, then GVAL deserves a serious look. In a market in which the U.S. has outpaced its foreign competitors for years, I consider GVAL to be an excellent, diversified rebound play on Europe and emerging markets,” according to Charles Sizemore.

GVAL’s current emerging markets exposure among its top 10 country weights does not lack for controversy. Brazilian stocks, embroiled in a graft controversy surrounding Petrobras (NYSE: PBR), made up 12% of GVAL’s weight at the end of the fourth quarter. Russia and Greece, rarely deliverers of good news, combined for another 14% of GVAL at the end of 2014, according to Cambria data.

“But herein lies the beauty of GVAL. Few investors would have thick enough skin to take a large position in any of these countries individually. But even investors with nerves of steel would have trouble building a viable portfolio of stocks from most of these markets due to the lack of available U.S.-traded ADRs to buy.   Very few investors have access to the small and mid-cap foreign stocks that dominate GVAL’s portfolio,” notes Sizemore.

The actively managed GVAL targets the cheapest, most liquid picks in countries where political or economic crisis have depressed valuations. GVAL’s eligible country universe includes Greece, Russia, Hungary, Ireland, Spain, Czech Republic, Italy and Portugal. At the end of 2014, 56% of the ETF’s country weight was allocated to Eurozone nations.

Investors can also access a sliver of GVAL via the Cambria Global Asset Allocation ETF (NYSEArca: GAA). Known as the ETF without an annual fee, GAA debuted in December and holds other ETFs. At the time of launched, GAA held a 4% weight to GVAL.

Global Macro ETF: A Rareview- Look No Further and Look Down Under $MVMVE

MarketsMuse global macro trading insight courtesy of extract from 4 Feb edition of Rareview Macro LLC’s “Sight Beyond Sight” with reference to $MVE and $MVMVE

Neil Azous, Rareview Macro

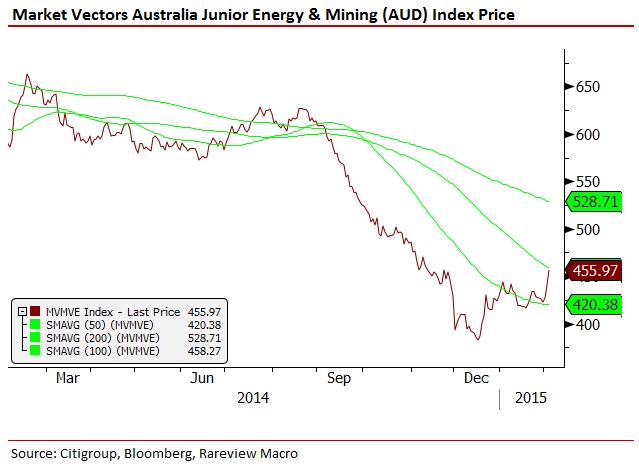
There are a lot of moving parts overnight, including the continuing debate on whether crude oil has bottomed or not. But if we had to focus on just one part of the narrative it would be Australia – the tentacles of which stretch out all the way to basic resources, yield, beta, deflation, and sentiment.

Now before dismissing any read through from this antipodean nation as not as relevant as other indicators, we would argue that what is happening there may well have more meaningful ramifications for global risk assets than most realize.

Firstly, the Market Vectors Australia Junior Energy & Mining Index (symbol: MVMVE) is showing the largest positive risk-adjusted return across regions and assets for the second day in a row.

By way of background, MVMVE covers the largest and most liquid Australian and offshore small-caps generating 50%+ of their revenues from energy & mining and listed in Australia. This basket of securities is not only highly geared to capex, utilities, infrastructure, and engineering but it is the poster child for Australia-Asia commodity speculation. Put another way, it has been the worst-of-the-worst and a favorite proxy to watch for those who hold the dogmatic view that China and Australia are both zeros.

We do not want to overemphasize the importance of just one index, so we are highlighting it more as a starting point than anything else. It is not uncommon for this index to show up on our equity monitor but it is rare for it to take the leadership across all regions and assets, and very rare for that to happen on back-to-back days. For that reason, it has prompted us to do some further analysis on that food chain.

Model Portfolio Update – Increased S&P 500 (SPY) Short Position Continue reading

State Street Slashes SPDR ETF Fees; Issuers In A Race to Zero? Nah..

MarketsMuse blog update courtesy of extract from news report by Reuters’ Ashley Lau

State Street Corp said on Tuesday it has slashed management fees on 41 of its SPDR exchange-traded funds, joining major ETF providers BlackRock Inc and Vanguard in their efforts to lower fees as price competition heats up.

The price cuts at State Street, which affect a range of international and domestic equity and bond funds, come at a time when cost has become an increasingly important factor for ETF providers. Vanguard, which recently surpassed State Street to become the No. 2 U.S. ETF provider, has been winning assets with its razor-thin fees.

With the new price reductions, State Street’s SPDR Barclays Aggregate Bond ETF, for example, now has an expense ratio of 0.1 percent, down from 0.21 percent. That brings the fund closer to the range of the Vanguard Total Bond Market ETF and the iShares Core U.S. Aggregate Bond ETF, which both have an expense ratio of 0.08 percent.

State Street said the fee reductions are part of an ongoing review process “to identify improvements that are beneficial to investors.”

“Competitive pricing is a core benefit to the SPDR ETF value proposition,” said James Ross, global head of SPDR ETFs at State Street Global Advisors, the company’s asset management business.

ETF assets have been flowing into Vanguard, long a leader in low fees. It increased its U.S. market share to 21.3 percent at the end of 2014, more than doubling its market share since 2008.

BlackRock, the largest ETF provider, has also been expanding its “iShares Core” lineup of low-cost ETFs, a program it started in October 2012 to compete with cheaper funds offered by other providers. The company said on Monday it would extend a partial fee waiver of annual management fees on certain iShares funds in Canada. (Reporting by Ashley Lau; Editing by Dan Grebler)


Confused About Crude? You’re Not Alone; Global Macro Traders Tongue-Tied

MarketsMuse excerpt from Feb 3 edition of Rareview Macro LLC’s  Sight Beyond Sight global macro commentary..

Professionals Not Discussing Crude Oil Strength…Short Euro Put on Hold

This is simple.

Neil Azous, Rareview Macro

WTI crude oil is now up ~18% from the January 29th lows. It is not a question of whether the bounce continues or worth debating whether a V-shaped or U-shaped recovery is materializing. What is more important is whether a low was made and a new medium-term range is now being carved out.

Now anyone who monitors cross-market correlation will understand that the price of a barrel of Brent crude oil is highly correlated with the inverse of the trade-weighted dollar. Therefore, if the price of oil is stabilizing there is a quantitative argument that the dollar will stop rising, at least in the short-term.

Professionals are highly sensitive to pattern recognition and the last two times the Euro-Dollar (EUR/USD) corrected (i.e. Oct & Dec 2014) the currency cross appreciated by 2.5-3.2%. This is in line with the current bounce off the low price (i.e. 2.6%) following the ECB meeting in January.

So the question is why is it that those who never participated in the first place or those that reduced their long dollar exposure at the end of 2014 and missed the January QE move, but believe the currency cross will trade down to parity (i.e. 100) by the end of this year, have not used this bounce to get short of EUR/USD, especially considering you now have policy confirmation from the ECB? Continue reading

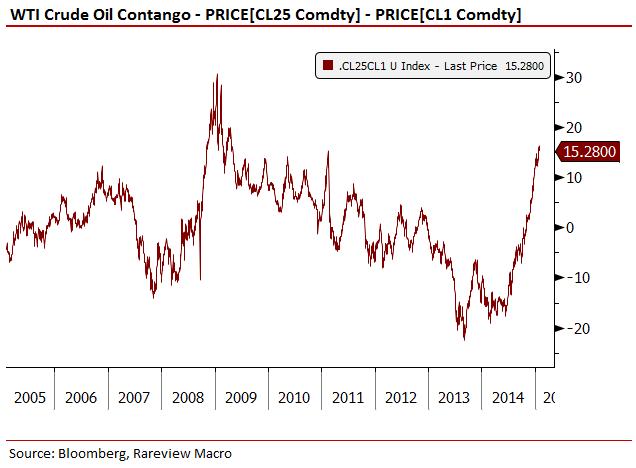
Crude Oil, Contango and Confusion; Global Macro View

MarketsMuse provides below extracts from Feb 2 edition of Rareview Macro’s Sight Beyond Sight as a courtesy to our readers. The entire edition of today’s SBS newsletter is available via the link below.

Neil Azous, Rareview Macro

Professionals Taking Move in Crude Oil Seriously…Concern Over Deeper Move Lower in Risk

  • No One Prepared for Deflation Risk to Subside
  • Left Tail Risk:  Removing Two Key Peg Break Conversations (for today)
  • China-Korea-Japan Battle – KRW/JPY Hedge
  • Switzerland – Update
  • Model Portfolio Update – January 30, 2015 COB:  -0.33% WTD, -0.88% MTD, -0.88% YTD

No One Prepared for Deflation Risk to Subside Continue reading