Tag Archives: todd shriber

contango-uso-etf-oil

Only Idiots Use USO ETF to Trade Oil-It Can’t Tango!

For those who are confused as to the near-term, or even longer-term price direction of Oil, even J.R. Ewing would tell you there isn’t an oil man in Texas, including Boone Pickens, who can see far beyond the prices posted at the pump. Especially when one gas station in Oklahoma is now selling one gallon for .99 –a price that has been seen in certain spots, but not since 1993 has oil been so ‘cheap.’ For those who try to express a bet on price direction via a financial instrument, one leading markets muse is going so far as to infer that “..Only idiots use the ETF $USO to make a bet with.” Why? It Can’t Tango!  Well…that’s perhaps a poetic license pun on words, but..

Courtesy of the universally-known ETF Professor Todd Shriber, who pens for financial news site Benzinga, the markets muse in question turns out to be one of the global macro world’s more eloquent and most thoughtful gurus.. Here’s the extract from Shriber’s early a.m. column:

To say the United States Oil Fund LP (ETF) (NYSE: USO), which tracks West Texas Intermediate crude oil futures, is a flawed product is accurate and fair. Over the past three years, USO is down 77.1 percent, but the exchange-traded product remains a favorite, on both sides of the oil trade, of professional traders.

Inflows to USO confirm as much. After adding nearly $3.1 billion in new assets last year, USO has seen year-to-date inflows of almost $900 million. USO’s 2016 inflows put it just outside of the year’s top 10 asset-gathering ETFs.

USO And Contango

Perhaps the greatest source of criticism against USO comes from the fact that the ETF is frequently in contango. As it pertains to USO, contango occurs when the West Texas intermediate futures currently held by the ETF trade at higher prices than the market expects that contract to trade at for the months ahead.

“Oil traders should be aware that USO tracks front-month WTI future contracts and the underlying oil market is currently in a state of contango. Consequently, USO could experience a negative roll yield when rolling a maturing futures contract, or selling a contract that is about to expire in exchange for the next month contract,” according to ETF Trends.

WTI And Negative Yield Rolls

Speaking of negative yield roll, West Texas Intermediate futures are currently facing an epic negative yield roll.

neil azous
Neil Azous, Rareview Macro

“The widening in the ‘contango’ between the first and second futures contracts, or the March-April spread (CLH6-CLJ6), has exploded to ~8 percent in negative roll yield,” said Rareview Macro founder Neil Azous in a note out Wednesday evening.

As Azous noted, West Texas Intermediate’s current level of contango is quadruple that of Brent crude, the global oil benchmark contract, on a percentage basis.

The problem for any trader, professional or retail, who is long USO is that instances of exaggerated West Texas Intermediate have previously given way to savage declines for that contract and USO.

“The extrapolation that the market will likely make into next week’s crude oil futures roll and options expiration is that the next leg lower in the barrel has started and this CLH6-CLJ6 spread can widen out dramatically as evidenced by the extreme widening to 25 percent back in the winter of 2008-2009 when the barrel finally bottomed out for that cycle,” added Azous.

Read more: http://www.benzinga.com/news/16/02/6246307/how-contango-could-affect-a-popular-oil-etf#ixzz3zt6Cpp2D


Oh My! RIAs: Forbes Advisor Playbook iConference-Sep 17-CE and CFP Credits

For RIAs who want to be smarter (and at the same time, earn CFP and CE credits, MarketsMuse points you to the Sept 17, Forbes Advisor Playbook iConference. Why? Well for one, Shark Tank shark extraordinaire Kevin O’Reilly a newbie ETF Issuer of exchanged-traded funds firm “O’Shares”  (whose first product is OUSA) will be a guest speaker, along with a list of other industry luminaries that include Schorders’ Head of US Multi-Sector Fixed Income Andy Chorlton, Tim Palmer, Head of Global Interest Rates for Nuveen, Luciano Siracusano, Chief Investment Strategist for WisdomTree.

What does the day long session include? 6 timely topics ranging from Capital Markets and Game Theory to debating Optimal Active vs. Passive Portfolio Construction. MarketsMuse knows this will be a must-attend simply because the program is being coordinated by Julie Cooling of RIAchannel and our favorite ETF journalist, Todd Shriber aka ETF Godfather will be one of the program’s moderators.

What’s In It For You? 6 CFP and 6 CIMA CE Credits!

How do you sign up? Click Here!

New ETF Combines Dividends And Renewable Energy Using A YieldCo

MarketsMuse blog update profiles a new ETF, Global X YieldCo Index ETF (NasdaqGM: YLCO), which launched, Thursday, May 28, 2015. The ETF, YLCO, comes from a new kind of asset called YieldCos that aim to provide a steadier income to investors through assets from the renewable energy industry. YLCO tracks the Indxx Global YieldCo Index, which is home to 20 stocks that are a part of nearly 65.7% of the ETF, YLCO ‘s weight. Some of these stocks include: 

  • TerraForm Power (NasdaqGS: TERP)
  • Brookfield Renewable Energy Partners (NYSE: BEP)
  • SuneEdison (NasdaqGS: SUNE)
  • First Solar (NasdaqGS: FSLR)

This MarketsMuse blog update is courtesy of ETFTrends’ Todd Shriber and his article, “Dividends and Renewable Energy? There’s an ETF for That“, with an excerpt below. 

ETFTrends-logo

Renewable energy stocks and dividends are not often thought of as synonymous, but an emerging asset class is changing that.

YieldCos are income-generating assets from the renewable energy space that look to deliver steady income to investors. Spun off as fully developed assets from parent companies, such as solar firms and wind farm operators, yieldcos are comparable to master limited partnerships (MLPs), an asset class that has been widely embraced by income investors in recent years.

A new ETF, the Global X YieldCo Index ETF (NasdaqGM: YLCO) helps investors access the burgeoning yieldcos asset class.

“YieldCos are formed when energy companies spin off fully developed assets, such as wind and solar farms, with long term contracts and an objective of returning cash flows to shareholders. Market capitalization for the YieldCo industry currently stands at $39 billion. With 11 announced IPOs in the pipeline, it has become an increasingly popular vehicle for energy firms,” according to a statement issued by Global X.

 To continue reading about this new ETF, YLCO, and the things it could do, click here.

Mining ETF Rises From The Ashes

MarketsMuse blog update profiles the SPDR Metals & Mining ETF that has recently performed very well over the past few months. When oil prices reached a new low in January it sent a ripple across other sectors including the metal and mining sectors. XME was trading at its lowest price since March 2009. Although the sector ETFs are still on their road to recovery, the ETF, XME, is showing drastic improvement compared to many others. This MarketsMuse blog update is courtesy of an ETFTrends’ article by Todd Shriber titled, “This ETF is Springing to Life“, with an excerpt below. 

ETFTrends-logo

Mining stocks and the corresponding exchange traded funds have moved in fits and starts over the past few years. Unfortunately, there have been more fits than pleasantries, but the moribund industry could finally be putting in a legitimate bottom.

Though it is still down 27.5% over the past year, the SPDR Metals & Mining ETF (NYSEArca: XME) is up nearly 8% over the past month. That is a solid run for an ETF that started the year trading at its lowest levels since the first quarter of 2009. [Woes for a Mining ETF]

XME is meriting of consideration as some analysts believe the worst is behind the commodities space. Those were the sentiments of R.W. Baird when the research firm upgraded Dow component Caterpillar (NYSE: CAT) and Joy Global (NYSE: JOY) to outperform on Monday, according to CNBC.

To continue reading about the rise of this mining ETF, click here.

The Real Driver Behind China ETF Action: Column A and Column B

MarketsMuse.com ETF update profiles the real driver behind the surge in China-focused exchange-traded funds courtesy of below extract from 28 April a.m. column by Todd Shriber of ETFtrends.com “Surprising Drivers of the A-Shares ETF Surge.”

It is not a secret that exchange traded funds holding Chinese equities, both A-shares trading on the mainland and Hong Kong-listed H-shares, have recently been delivering staggering returns.

Over the past month, the top 13 non-leveraged ETFs are all China funds, according to ETFScreen.com. That group includes 4 A-shares ETFs, an impressive number considering there are just seven such funds trading in the U.S. Year-to-date, seven of the top 11 non-leveraged ETFs are China funds, four of which hold A-shares.

Beijing-controlled companies have been driving the Shanghai Composite higher, creating a divergence between that benchmark index and the Shenzhen Stock Exchange Composite Index. (See Dec 2014 ETFtrends.com for background)

“The explanation for this divergence revolves around State Owned Enterprises,” said Rareview Macro founder Neil Azous in a note out Monday. “The Shanghai Index is composed of ~68% SOE and ~32% non-SOE whereas the Shenzen Index is only 22% SOE and 78% non-SOE.”

Granted, it is just a small data set, but over the past week the SOE-heavy ASHR and PEK have performed in-line with the Deutsche X-trackers Harvest CSI 500 China A-Shares Small Cap Fund (NYSEArca: ASHS) as each have raced to all-time highs.

Azous notes that speculation about China’s plans to possibly reduced the number of SOEs via mergers has contributed to the rally. For example, there is speculation that PetroChina (NYSE: PTR) and China Petroleum & Chemical could be merged to create that country’s equivalent of Exxon Mobil (NYSE: XOM). Those stocks combine for almost 1% of ASHR’s weight.

For the entire article by ETFtrends.com Todd Shriber, please click here

Why Isn’t Chipotle (NYSE:CMG) Served In Consumer Market ETFs?

MarketsMuse.com ETF update is courtesy of exclusive reporting by Todd Shriber of ETFtrends.com with a tasty title:

No Burritos for ETF Investors as Funds Skimp on Chipotle

Todd Shriber, ETFtrends.com

Shares of Chipotle (NYSE: CMG) have risen more than fivefold over the past five years. That performance and an almost $700 price tag solidify Chipotle’s status as storied, once-in-a-lifetime consumer discretionary growth stock on par with Netflix (NasdaqGS: NFLX) and Priceline (NasdaqGS: PCLN).

However, with Chipotle set to deliver its first-quarter earnings today after the close of U.S. markets, exchange traded fund investors are reminded of the difficulties of accessing the burrito maker’s shares via ETFs.

Just two ETFs feature Chipotle as a top 10 holding, according to S&P Capital IQ data. The PowerShares Dynamic Leisure and Entertainment Portfolio (NYSEArca: PEJ), which in the past has garnered weights of roughly 5% or more to Chipotle, currently does not own shares of the stock.

Lack of ETF access to Chipotle is punitive given the company’s penchant for delivering blow-out results.

“Consensus estimates call for EPS of $3.64, vs $2.64 a year earlier (+38%). The company has beat estimates in the past three quarters. Consensus for all-important comparable-store sales is +11.6%. This compares with with +16.1% in the fourth quarter of fiscal 2014. The other metric to watch out for is gross margin – in the fourth quarter, food costs grew 110bps and held back margin progression,” said Mischler Financial Group analyst Neil Currie in a note out today.

“Regarding comp-store sales, we think there is some potential for consensus to be beat. While the consensus estimate would represent a two-year stack of +25.0%, similar to Q4, we think three-year stacks have proved an important metric for CMG. Based on this consensus, the three-year stack would be +26.0%. This compares with around +30.0% for the past three quarters. It is conceivable that CMG’s reported comp-store sales could reach the 14-15% mark on this basis,” adds Currie.

TO READ THE ENTIRE STORY FROM ETFTRENDS.COM, PLEASE CLICK HERE

The Highly Anticipated Launch Of The Apple Watch Isn’t Reflecting In Its ETFs

What time is it? Time for you to a buy a watch, an Apple Watch that is. After the announcement of the Apple Watch this past Fall, consumers have been waiting to get their hands on this product. Understandably so, investors couldn’t wait the launch either. With prices for an Apple Watch ranging from $349-$17,000, it will most likely bring a good return on investment. However, as pre-orders have been coming in for the Apple Watch, the same can’t be said for ETFs heavy on shares of Apple. MarketsMuse blog update profiling the little excitement in Apple ETFs is courtesy of ETF Trends, Todd Shriber, with an extract from his article, “Apple Watch a Non-Event for Apple ETFs” below.

ETFTrends-logoApple (NasdaqGS: AAPL) is taking preorders for its much ballyhooed Apple Watch. Or was taking preorders.

Nearly of the models made available to U.S. consumers sold out in just six hours and it looks the April 24 availability date announced by the company at the Apple Watch unveiling event last month is getting pushed back. Perhaps as far out as the third quarter.

“Whether due to high demand or low supply, all models of Apple Watch have now almost entirely sold out with many slipping delivery date estimates in mere minutes of preorders opening. In the US, the 38 mm Stainless Steel Case with Black Classic Buckle is the only model still on offer with a ‘April 24th – May 8th’ shipping date,” reports9to5Mac.com.

Unveiling a new product with preexisting, pent-up demand is old hat for Apple and that might explain the lack of enthusiasm for the blowout preorders being displayed by exchange traded funds heavy on shares of Apple. Even shares of California-based Apple are trading slightly lower today.

To read the full article from ETF Trends’ Todd Shriber, click here.

Risk Off or Risk On for Sweden ETF $EWD As Riksbank Takes Rates Deeper Into Negative Territory

MarketsMuse.com update profiling iShares MSCI Sweden ETF ($EWD) and a global macro view is courtesy of extract from March 18th coverage by ETFtrends.com’s Todd Shriber

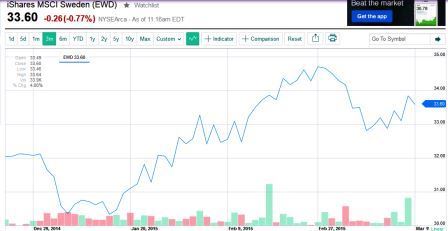
Shares of the iShares MSCI Sweden ETF (NYSEArca: EWD) were modestly higher Wednesday after the Riksbank, the world’s oldest central bank, surprisingly took Sweden’s repo rate deeper into negative territory with a cut of 15 basis points to -0.25% from -0.1%

ETFTrends-logoSome of Sweden’s larger companies are struggling due to weak demand from Europe, the country’s largest export market, as the krona currency appreciated against the euro. However, lower central bank rates has helped stimulate household spending.

The Swedish central bank recently cut its benchmark rate below zero for the first time and started buying bonds to combat deflationary pressures. However, if the krona continues to strengthen, the Riksbank could be forced to implement more aggressive measures. [Loose Monetary Policy Could Lift Sweden ETF]

In its efforts to stimulate inflation, Riksbank may not be done employing accommodative monetary policy.

“For us, we will pay close attention to the door they opened to launching a scheme to channel monetary support directly to corporations via lending. While no details were provided for the second meeting, we have for some time believed that a funding-for-lending program (FLS), a measure already used by the Bank of England, or a public-private investment program (PPIP), a liquidity tool used by the US Federal Reserve, are transmission mechanisms that have much greater and immediate impacts on the real economy than quantitative easing,” said Rareview Macro founder Neil Azous in a note out Wednesday. Continue reading

China ETF: One From Column A, One From Column B :$AFTY

MarketsMuse ETF market update profiling the latest A-Shares initiative out of China is courtesy of extract from coverage by ETFTrends’ Todd Shriber..

Todd Shriber, ETFtrends.com

CSOP Asset Management is not a household name in the U.S., but the Hong Kong-based asset manager could change that with today’s launch of its first U.S-listed exchange traded fund, the CSOP FTSE China A50 ETF (NYSEArca: AFTY).

The CSOP FTSE China A50 ETF is first ETF to be listed independently in the U.S. by a Chinese asset management company. Previous versions of A-shares ETFs to list in the U.S. have been partnerships between a U.S.- or Europe-based ETF issuer and a China-based asset manager. Those partnerships are pivotal to ETF issuers being able to offer U.S. funds that feature physical access to China’s A-shares because a Renminbi Qualified Foreign Institutional Investor (RQFII) meets Chinese regulatory requirements to be a foreign owner of A-shares.

For the full story from ETFtrends.com, please click here

Cancer Treatment ETF Surges In Past Few Days

MarketMuse update courtesy of extract from Todd Shriber’s latest piece at ETFTrends. 

ETFTrends-logoShares of Pharmacyclics (NasdaqGS: PCYC), a maker of cancer treatments, surged nearly 17% Wednesday, extending a run that has seen the stock surge 80.1% this year, on news that the California-based company is mulling a sale.

Citing unidentified sources, Bloombergreports that Dow component Johnson & Johnson (NYSE: JNJ)and Swiss pharma giant Novartis (NYSE: NVS) could be among the suitors for Pharmacyclics. Multiple suitors for the company could prove to be a boon for the First Trust NYSE Arca Biotechnology Index Fund (NYSEArca: FBT), one of a scant number of exchange traded funds that have decent exposure toPharmacyclics.

Shares of FBT climbed 1.9% Wednesday on volume that was more than 25% above the three-month trailing average thanks in part to the ETF’s nearly 4.1% weight to Pharmacyclics. The stock was FBT’s third-largest holding as of Feb. 24, helping the ETF join 24 other healthcare funds among the 195 ETFs that hit all-time highs yesterday.

Where things get interesting for Pharmacyclics, and as a result, FBT, is how much of a premium a suitor will pay. Pharmacyclics closed Wednesday with a market value of $16.6 billion. Sources told Bloomberg the company could fetch $17 billion to $18 billion. The Financial Times reported Pharmacyclics could command $19 billion.

For the entire article from ETFtrends.com, please click here

China ETFs Seeming More Like The Year Of The Bear

MarketMuse update courtesy of ETFTrends’ Todd Shriber looking at China related ETFs. 

In the Chinese zodiac, 2015 is the year of the goat, but a popular exchange traded fund tracking China’s onshore equities is getting bearish treatment.

The Deutsche X-trackers Harvest CSI 300 China A-Shares ETF (NYSEArca: ASHR), the largest U.S-listed A-shares ETF, had 6.3% of its shares outstanding sold short as of Feb. 23, reports Belinda Cao forBloomberg.

ASHR surged 51.3% last year, making it one of 2014’s best-performing non-leveraged ETFs. That performance was better than quadruple the showing by the iShares China Large-Cap ETF (NYSEArca: FXI), the largest U.S.-listed China ETF. However, the 2014 A-shares rally has those stocks looking richly valued relative to their Hong Kong-listed counterparts, encouraging traders to up bearish bets on ASHR.

“The number of shares borrowed and sold short to profit from a decline in Deutsche Bank’s A-share ETF was 1.8 million on Feb. 23. That’s close to the record of 2.4 million, or 8.2 percent of total shares outstanding, reached Feb. 13,” Bloomberg reports, citing Markit data.

However, another catalyst could be encouraging the increased bearish bets on ASHR. On Jan. 21, Deutsche Asset & Wealth Management (DAWM) was forced to limit creations of new shares in ASHR because increased demand for the ETF was forcing the fund o bump up against their respective Renminbi Qualified Foreign Institutional Investor (RQFII), which allows the funds to purchase A-shares equities

Creation limits often lead to ETFs, particularly those with exposure to markets that are closed during the U.S. trading day, trading at premiums to net asset value. Professional traders then look to profit from the gap between the ETF’s market price and lower NAV by shorting the ETF. Since the start of 2015, ASHR has traded at a premium to its NAV in 26 days, according to DAWM data.

Although the most recently announced creation limit for ASHR has not yet been lifted, it should be noted the ETF was affected by the same scenario twice in 2014 and DAWM was quick to get ASHR’s RQFII limit increased.

With ASHR’s 2014 surge, some money managers now prefer H-shares to A-shares, but that means they are also missing out on a notable rally in A-shares small-caps.

The Deutsche X-trackers Harvest CSI 500 China A-Shares Small Cap Fund (NYSEArca: ASHS), which was subject to a second creation limit last November, is up 12.1% this year. ASHS tracks the CSI 500 Index of Shanghai- and Shenzhen-listed small-caps.

The Market Vectors ChinaAMC SME-ChiNext ETF (NYSEArca: CNXT), the younger of the two A-shares small-cap ETFs, has surged 23.7% year-to-date, making it 2015’s top-performing non-leveraged ETF. CNXT, which is heavily allocated to mid-caps, tracks the SME-ChiNext 100 (SZ399611), which provides exposure to the 100 most liquid mid- and small-cap stocks that trade on the Small and Medium Enterprise (SME) Board and the ChiNext Board of the Shenzhen Stock Exchange (SZSE).


Threat Of Hackers Grows And So Does Cyber Security ETFs

MarketMuse update courtesy of Todd Shriber of ETF Trends, profiles the increase in cyber security ETFs as the threats of being hacked become more and more relevant.

The PureFunds ISE Cyber Security ETF (NYSEArca: HACKcontinues to cement its status as a legitimate event-driven exchange traded fund.

HACK is higher by 0.7% Tuesday on volume that is already more than quadruple the daily average after Russia’s Kaspersky Lab, a major cyber security firm, said a group of hackers have stolen as much as $1 billion from over 100 banks in 30 countries since late 2013.

Various media outlets are reporting those hackers are more interested in financial gain than pilfering personal information from the banks’ customers. That point is unlikely to assuage the banks or their customers, but it is enough to have HACK trading at record highs for the second consecutive session.

HACK’s Tuesday momentum is carrying over from last Friday when the ETF soared to a record high on volume of nearly 1.4 million shares as President Obama hosted the first-ever cyber security summit, which featured luminaries from throughout the tech industry, including Apple (NasdaqGS: AAPL) CEO Tim Cook.

Importantly, most of the action in HACK last Friday was of the bullish variety. So intense was buying activity in the ETF that the fund is now home to $231 million in assets under management, confirming HACK’s place on the list of most successful ETFs to debut in 2014. Impressively, HACK’s ascent to $231 million in AUM means the ETF has more than doubled in size over the past six weeks after topping $100 million in assets in early January. The ETF debuted in November.

News of the $1 billion bank hack, while positive for HACK in the near-term, also serves as reminder of the long-term opportunity with the ETF because the financial services industry is expected to be one of the largest spenders on cyber security enhancements in the coming years.

In October 2014, J.P. Morgan Chase (NYSE: JPM) CEO Jamie Dimon said the banking giant will likely double its cyber security spending to $500 million within the next five years.

HACK benchmarks to the ISE Cyber Security Index, “which tracks the performance of companies actively engaged in providing services for cyber security and for which cyber security business activities are a key driver of their business model. These cyber security services are designed to protect computer hardware, software, networks and data from unauthorized access, vulnerabilities, attacks and other security breaches,” according to PureFunds.


German ETFs Offer Good Opportunities in Rebounding European Market

MarketMuse update is courtesy of ETF Trends’ Todd Shriber.

Earlier this week and over the past few months, MarketMuse has been covering the rocky European market, thanks to Greece, and its recent rebound, with ETF $GVAL. Now investors have even more to be excited about with the recent success of German ETFs. 

The U.S. is not the only developed market where stocks are eying record highs. Germany’s benchmark DAX accomplished that feat Friday, climbing above 11,000 for the first time.

Exchange traded fund investors are responding, pumping massive of amounts of capital into Germany ETFs. The Recon Capital DAX Germany ETF (NasdaqGM:DAX), the only U.S.-listed DAX-tracking ETF, is up nearly 8% in the past month.

With its heavy tilt toward large, multi-national companies, the DAX index is benefiting from a depreciating euro currency. A weaker euro would help support export growth and potentially generate greater revenue from overseas operations for the multi-nationals.

A weak euro and sturdy data out of the Eurozone’s largest economy is prompting investors to put new capital to work with Germany ETFs. Through Thursday, only three ETFs have seen greater inflows than the $494.1 million added to the iShares MSCI Germany ETF (NYSEArca: EWG), the largest Germany ETF.

One of those three is the WisdomTree Europe Hedged Equity Fund (NYSEArca:HEDJ), which allocates 26% of its weight to German stocks. No ETF has seen larger 2015 inflows than HEDJ’s $4.1 billion in new assets and the gap between HEDJ and the second-place inflows ETF, the SPDR Gold Shares (NYSEArca: GLD), is sizable at over $1.6 billion.

Thanks to the faltering euro, investors are also flocking to currency hedged Germany ETFs. After taking in $450 million on Thursday, the iShares Currency Hedged MSCI Germany ETF (NYSEArca: HEWG) has added over $491 million this week. The ETF, which uses EWG with a EUR/USD hedge, had $287.4 million in assets heading into Thursday.

On a percentage basis, the Deutsche X-trackers MSCI Germany Hedged Equity Fund (NYSEArca: DBGR) and the WisdomTree Germany Hedged Equity Fund (NasdaqGM: DXGE) have also seen significant asset growth. DXGE has more than doubled in size this year while DBGR has tripled in size since the start of 2014.

Underscoring the advantage of the euro hedge with German equities, DBGR and DXGE have both produced double-digit returns over the past month while EWG is up “just” 7.5%. Importantly, economic data supports the case for more upside for Germany ETFs,

“German gross domestic product expanded 0.7 percent in the fourth quarter, soaring past an estimate for 0.3 percent. Private consumption rose markedly in the fourth quarter, and investment developed positively, driven by a significant increase in construction output,” reports Inyoung Hwang for Bloomberg.


Russia’s ETF Tries to Get Back On The Horse

MarketMuse update courtesy of ETF Trends’ Todd Shriber.

MarketMuse has been profiling the recent market turmoil found all across Europe but mainly Greece and Russia. After a difficult past six months, Russia’s ETF has recently been back on the rise. 

Entering Tuesday, the Market Vectors Russia ETF (NYSEArca: RSX) sported a six-month loss of 35.2%, making it difficult to be bullish on Russian equities.

However, what is now a three-day rally for oil futures is compelling some traders to revisit RSX and the adventurous are even mulling positions in the Direxion Daily Russia Bull 3x Shares (NYSE: RUSL), the triple-leveraged equivalent to RSX. RSX is the oldest, largest and most heavily traded Russia listed in the U.S.

Over the past five days, the United States Brent Oil Fund (NYSEArca: BNO) is up more than 14%, which is important because Russia, the largest non-OPEC producer in the world, prices its oil in Brent terms, the global benchmark. RSX and RUSL have responded with arguably tepid five-day gains of 1.6% and 4.3%, respectively.

Still, traders with temerity might want to give RUSL a look because there are signs of capitulation among RSX bears.

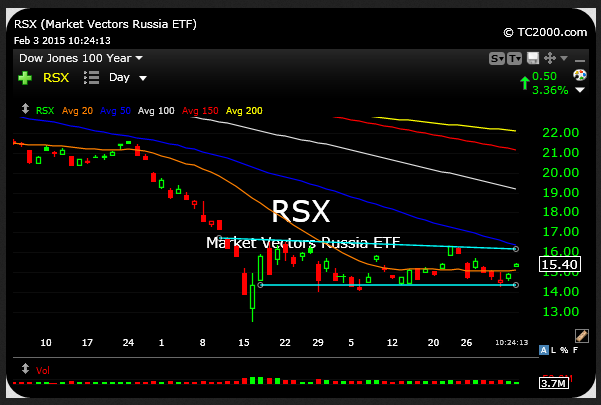
“The RSX, country ETF for Russia, seen below on the daily timeframe, shows a consolidation pattern which has morphed into a sideway channel. Bears have thus far failed to crack it lower, perhaps blinded by love for a crash in crude and failing to recognize the temporary bottoming signs in place for energy and energy stocks. Thus, RUSL is on my radar as a levered long play, especially if RSX holds over $15.30 today,” according to Chessnwine of Market Chess.

Russia ETF

Lunch with Russia ETFs, in particular RUSL, is far from free. RSX has a three-year standard deviation of 27.2%. Said another way, RSX has been 1,200 basis points more volatile than the MSCI Emerging Markets Index over the past three years.

Additionally, oil prices will likely determine the near-term fate of RSX and RUSL. After all, no non-OPEC is as heavily dependent on oil as a driver of government revenue as Russia is. Nearly half of Russia’s government receipts come by way of oil exports.

Of course, there is the valuation argument, a familiar refrain of Russia bulls in recent years. Indeed, Russian stocks are down right cheap. At a forward P/E of four, the MSCI Russia Index trades at less than half valuation of the MSCI Emerging Markets Index and about a quarter of the valuation of the S&P 500.

There is another interesting point in favor of RUSL: Investors’ tendency to be wrong with leveraged ETFs. RUSL has seen outflows of over $21 million over the past month,according to Direxion data.

There is validity in going against the crowd with leveraged ETFs. Consider this: From about Aug. 20, 2014 to Sept. 23, the Direxion Daily Gold Miners Bear 3X Shares (NYSEArca: DUST) lost $185.3 million in assets but surged 55% over that period.

Breaking News: The Black Swan from Switzerland: A Macro View and the ETF Angle

Marketsmuse.com update profiling Swiss National Bank (SNB) lowering of deposit rate to a -0.75% has, as noted by Neil Azous of global macro think Rareview Macro LLC,  “shocked the markets” and “will be booked into the Black Swan record books as an event to be remembered. ” Below update starts with extract from late morning edition of Rareview Macro’s “Sight Beyond Sight” and followed by the ETF angle, courtesy of late morning summary from ETFtrends.com

Neil Azous, Rareview Macro

Historic Day for Global Investors…Impact Will Be Felt for Weeks to Come

  • Model Portfolio – Update
    Can You Trade Swiss Franc?
    Commodities – Quick Thoughts
    Big Picture – Asset Allocation


This morning, in a move that shocked the markets, the Swiss National Bank (SNB) removed its minimum exchange rate policy of holding the Euro-Swiss (EUR/CHF) at 1.20, lowered its deposit rate to -0.75% from -0.30%, and their target LIBOR rate to between -1.25% and -0.25%. The main reason offered by the SNB for its decision was the strength of the US Dollar and the diverging monetary policy between regions.

As a reminder, the SNB had a regularly scheduled meeting on December 11th where no changes to policy were made, just a reiteration that it remained steadfast in its commitment to the EUR/CHF 1.20 floor. On December 18th, largely as a result of very strong safe-haven inflow from Russia, the SNB surprised the market and reduced its deposit rate to -0.30% from -0.05%, surpassing the European Central Bank’s (ECB) which set its deposit rate at -0.25%. Two days ago the SNB’s vice-chairman said that the bank “are convinced that the minimum exchange rate must remain the cornerstone of our monetary policy”. In other words, there was no warning of this.

Since the EUR/CHF 1.20 floor was introduced a few years back the market sentiment was firm in that if the floor was to ever break then the initial downside risk was 1.15-1.10 at a maximum.

The Electronic Broking Services (EBS), the benchmark for professional FX trading, said the market low for the EUR/CHF on its platform was 0.8500 Francs per Euro and confirmed the “miss-hit” at 0.0015.

THAT MEANS NO ONE GOT STOPPED OUT OF THEIR LONG EUR/CHF POSITION ABOVE 1.0000!

This is not the commodities market, where traders place stop-limit orders and wait for a product to bounce back before being taken out of their position due to illiquidity. It is FX where stop-loss orders are predominantly used and you are taken out at the level at which the market first traded.

Therefore, today will go down in history as a “Black Swan” event. Continue reading

Philippines Has Rising Star in the ETFs Market

MarketMuse update courtesy of ETF Trends’ Todd Shriber.

After finishing lower for a second consecutive year in 2014, diversified emerging markets exchange traded funds are off to decent though not spectacular starts in 2015.

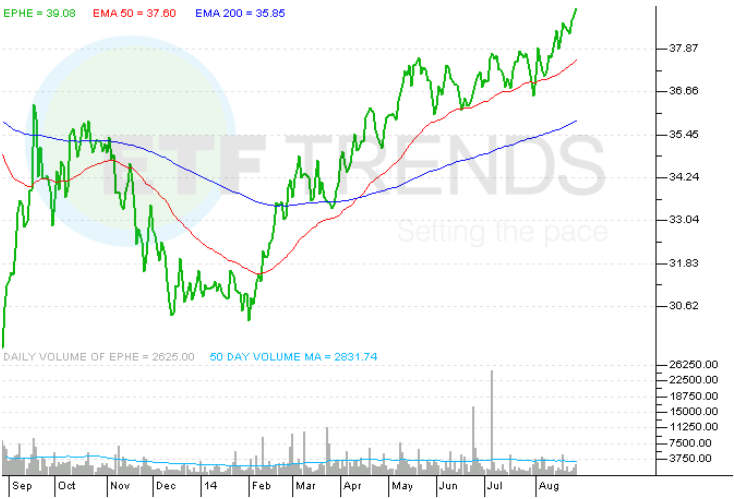
Off to a more impressive start than broader peers, such as the iShares MSCI Emerging Markets ETF (NYSEArca: EEM) and the Vanguard FTSE Emerging Markets ETF (NYSEArca: VWO), is the iShares MSCI Philippines ETF (NYSEArca: EPHE). EPHE, the lone Philippines ETF, entered Friday with a 2015 gain of 2.6%, or nearly quadruple that of VWO.

In 2014, EPHE gained more than 22% while EEM and VWO each finished the year in the red. EPHE now resides less than 10% below its all-time high set in January 2013 and more gains could be on the way after stocks in Manila rose to a record during Friday’s Asian session.

Like India, the Philippines is getting a significant economic boost from lower oil prices because the Philippines is dependent on oil imports to help power one of Southeast Asia’s fastest-growing economies. Over the past six months, the U.S. Oil Fund (NYSEArca: USO) has plunged 51%, but the WisdomTree India Earnings Fund (NYSEArca: EPI) and EPHE have traded modestly higher over that period.

Investors are paying up to be involved with Philippine equities.

“Shares in the Philippine Stock Exchange Index are valued at 18.4 times 12-month estimated earnings, the highest since Nov. 26. The gauge has the highest multiple among Asia’s benchmark equity indexes,” reports Michael Patterson for Bloomberg.

The MSCI Emerging Markets Index trades at about 11 times earnings, but that did not prevent EPHE from hauling in $44.3 million in new assets last year. That is nearly 12% of the ETF’s current assets under management, indicating U.S. investors remain underweight Philippine equities. That may not be the case for long.

“The Taiwanese, Philippine and South Korean stock markets also warrant over-emphases on account of their stable political regimes, reliable policymaking climates and healthy economic prognoses,” said S&P Capital IQ.

For 2015, Morgan Stanley “said the Philippines was the best-positioned market due to its ample liquidity, strong forecast gross domestic product growth and low levels of credit penetration,” reports The Star.

A stronger U.S. dollar is helping Philippine stocks beyond lower oil prices. Foreign remittances are now worth more when converted into pesos, helping boost the local economy. EPHE allocates nearly 12% of its weight to consumer sectors.

In fact, the Philippines has already issued dollar-denominated bonds this year, becoming the first emerging market to do so. The Philippines can afford to do that because its external funding costs are low relative to other developing economies and the country has an investment-grade rating from all three major ratings agencies.

For the original article by Todd Shriber from ETF Trends, click here.

Option Traders Aim For More Declines in Junk Bond ETFs

MarketsMuse update courtesy of extract from ETFtrends.com column by Senior Editor Todd Shriber..

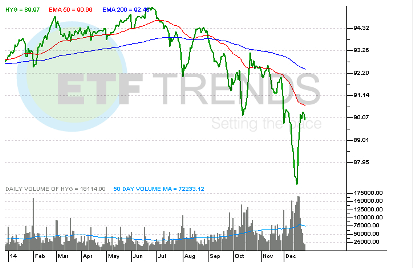
ETFTrends-logoExchange traded funds holding high-yield debt have stumbled this year due in large part to sliding oil prices. Some options traders are betting on further declines for the iShares iBoxx $ High Yield Corporate Bond ETF (NYSEArca: HYG), the largest junk bond ETF.

Options hedging against swings in HYG “cost the most since 2010 versus those on an ETF following Treasuries and were at an almost six-year high relative to contracts on a Standard & Poor’s 500 Index fund,” report Inyoung Hwang and Jonathan Morgan for Bloomberg.

HYG is off 3.1% this year, but the ETF’s declines and those of its rivals have worsened in the back half of the year as oil’s slide has gained speed. HYG is off 5.6% over the past six months as the United States Oil Fund (NYSEArca: USO) has plunged nearly 47% over the same period.

The message from the options market regarding HYG is clear: More declines are on the way.

“About 56,000 bearish and bullish options changed hands daily on average in December, compared with an annual mean of less than 23,000 through the end of November,” according to Bloomberg.

As oil prices have tumbled, high-yield corporate bond investors have become skittish due to the rising influence of the energy sector within the U.S. junk bond market. Energy issuers account for 15% of the U.S. high-yield market, up from less than 10% seven years ago. [Oil Will Drag Junk Bond ETFs Down]

Oil and gas issuers account for 13.5% of HYG’s weight, the ETF’s second-largest sector allocation behind a 14.9% weight to consumer services.

Then there is the matter of increased leverage. At the end of the second quarter, U.S. shale producers had a total of $190.2 billion in debt, up from less than $150 billion at the end of 2011, according to Bloomberg data.

For the entire story from ETFtrends.com, please click here.

Mr. Shriber has been involved with financial markets for over a decade and has been writing about ETFs for over seven years. Prior to joining ETF Trends, Mr. Shriber was the chief ETF analyst at Benzinga. His written work has appeared on MarketWatch, Minyanville and Investopedia, among other web sites and major daily newspapers such as the New York Times and Washington Post.

Junk Bond ETFs: SOS for HY Sector ($USO, $XOP, $JNK, $HYG)

etf-logo-finalBelow extract is courtesy of Oct 13 edition of ETFtrends.com and senior editor Todd Shriber

The United States Oil Fund (NYSEArca: USO) is off 6.4% in the past month as West Texas Intermediate, the U.S. benchmark oil contract, ominously descents to $80 per barrel.

Oil’s slide has wrought havoc for futures-based ETFs, such as USO, as well as scores of equity-bae funds with energy sector exposure. After a 9.5% third-quarter loss, was once the top-performing sector in the S&P 500 earlier this year has now turned into one of the worst groups. [Dour View on Energy ETFs]

Of the 25 worst-performing exchange traded funds over the past month, 12 are equity-based energy funds. However, weakness in the energy sector could be problematic for some an asset class some investors may not be overlooking as a victim of energy’s slide: High-yield bonds and the corresponding ETFs.

Booming production at the Eagle Ford Shale and other shale formations has helped make Texas the envy of large state economies. That same theme has also been viewed as one of the more favorable long-term catalysts for ETFs ranging from the SPDR S&P Oil & Gas Exploration & Production ETF (NYSEArca: XOP) to the Market Vectors Unconventional Oil & Gas ETF (NYSEArca: FRAK), but oil’s decline is threatening producers ability to profitably tap North American shale plays. [Fracking ETFs Foiled by Slumping Oil Prices]

“Texas is the anchor to shale production, employment growth, positive real estate trends, and overall positive moral. With Crude Oil at or below the cost of production for many project, the State with the highest economic multiple needs to contract,” said Rareview Macro founder Neil Azous in a research note.

But there’s more, including the threat falling oil prices pose to the high-yield bond market. Continue reading