MarketsMuse global macro trading insight courtesy of extract from 4 Feb edition of Rareview Macro LLC’s “Sight Beyond Sight” with reference to $MVE and $MVMVE

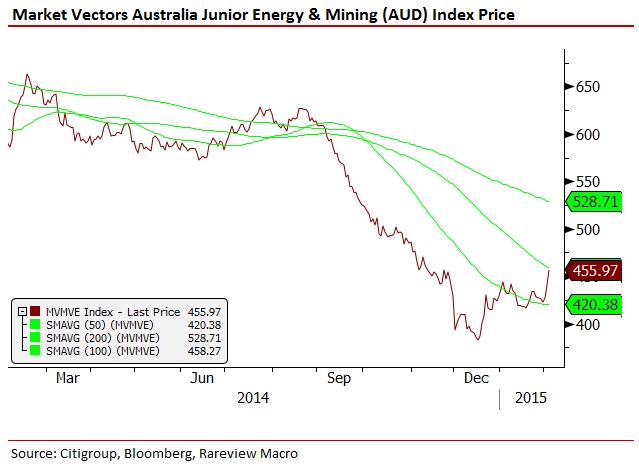
There are a lot of moving parts overnight, including the continuing debate on whether crude oil has bottomed or not. But if we had to focus on just one part of the narrative it would be Australia – the tentacles of which stretch out all the way to basic resources, yield, beta, deflation, and sentiment.
Now before dismissing any read through from this antipodean nation as not as relevant as other indicators, we would argue that what is happening there may well have more meaningful ramifications for global risk assets than most realize.
Firstly, the Market Vectors Australia Junior Energy & Mining Index (symbol: MVMVE) is showing the largest positive risk-adjusted return across regions and assets for the second day in a row.
By way of background, MVMVE covers the largest and most liquid Australian and offshore small-caps generating 50%+ of their revenues from energy & mining and listed in Australia. This basket of securities is not only highly geared to capex, utilities, infrastructure, and engineering but it is the poster child for Australia-Asia commodity speculation. Put another way, it has been the worst-of-the-worst and a favorite proxy to watch for those who hold the dogmatic view that China and Australia are both zeros.
We do not want to overemphasize the importance of just one index, so we are highlighting it more as a starting point than anything else. It is not uncommon for this index to show up on our equity monitor but it is rare for it to take the leadership across all regions and assets, and very rare for that to happen on back-to-back days. For that reason, it has prompted us to do some further analysis on that food chain.
Model Portfolio Update – Increased S&P 500 (SPY) Short Position
As a reminder, we were long 3500 SPY 3/20/15 205-190 put option spreads.
This was a part of the original book overlay (i.e. 5000 option spreads) established on December 31, 2014. After the first ~100 point move down in the S&P 500 to start the year we sold 1500 option spreads to take profit.
Yesterday, we bought 3500 SPY 3/20/15 P190 for $.1.50. On the view that the US equity market has moved up to far too fast, we bought back the short put option leg. It turns out we paid a little less than what we originally sold it at.
Additionally, to match our conviction level at the beginning of the year, we felt it was prudent to increase the long put option position back to its original level.
Specifically, we bought 1500 3/20/15 P205 for 5.20 to open. In strike notional terms we are now short $100 million SPX or 1/3rd of the model portfolio NAV.
Simply stated, at the higher end of the index trading range we just wanted to get even shorter of the S&P 500. The updates were sent in real-time via Twitter.
For the complete edition of today’s Sight Beyond Sight from global macro strategy think tank Rareview Macro LLC, please visit their site via this link

