Tag Archives: Crude Oil

Global Macro View-Friday’s Stock Rally In Perspective

MarketsMuse curators have canvassed assortment of guru-types who have attempted to decipher Friday’s stock rally, along with tuning in to the abundance of Monday morning quarterback views. For those who turn to the cartoon channel (i.e. CNBC), some pundits call it a dead cat bounce, more optimistic professional traders and pontificators would like to believe the spike on Friday is a sign of a “bottoming formation”–irrespective of many signals that suggest the “R-word” will become more frequently used when describing the state of the US economy. Smarter money, particularly those who have Sight Beyond Sight are focusing on following a private weekend comment summarizing last Thursday’s email newsletter from global macro think Rareview Macro…

neil azous-global-macro
Neil Azous, Rareview Macro

Factually the 14-day (Relative Strength Index) or “RSI” on the SPX Index is now 39; no one with a straight face can say the market is oversold technically. Last week, when the S&P futures bounced off the lows the professional community was open to the notion that the index could trade back up into the 1920-1960 range. That has not happened despite three key things:

  1. President Draghi has backing of the Committee now to ease policy further;
  2. The FOMC was dovish and the implied probability of a hike in March now is at 18% (it was ~28% yesterday); anything below 20% most likely means it’s going to zero; unconditional probability of June is exactly 20%; post-March FOMC that is most likely around 33% or 3 to 1 AGAINST;
  3. Crude oil has taken out last week’s highs multiple times and broken the downtrend channel today on an intra-day basis. Additionally, the market has removed the majority of event risk related to Yen and Nikkei heading into the BoJ meeting tonight on the view that if the BoJ eases they go big (20 bonds, 1-3 ETF, and even cut IOER) because they can’t risk an incremental easing that the market rejects.

The key question is with largely every asset now discounting these central bank events and the high degree of correlation of risk assets to crude oil, especially the S&P 500, why has the S&P not responded and traded up to the expected range of 1920-1960?

The answer is that tomorrow the BEA releases their quarterly update for corporate profits (Bloomberg Ticker: CPFTYOY Index). Last quarter it was down -5.74%. The key point being is that tomorrow brings a likely confirmation of two-quarters in a row of declining profits – or a “profit recession”. Remember, this is a clean look at profitability and there are no footnotes like a company specific earnings release that can attempt to paint any Picasso they want.

Additionally, ISM Manufacturing data is released on Monday and in order for the cyclical call bounce to begin to materialize it can’t show another print to the downside. Right now the market has shifted to a 40-50% probability of a forthcoming recession up from 10-20% to start the year. Confirmation of further ISM Manufacturing weakness will only accentuate the view that 11 of the last 13 recessions included ISM Manufacturing printing below the 50 level.

So while you may have to wait for two-quarters in a row of negative GDP at some point in the future to get formal confirmation of a recession, the risk is that corporate profits and manufacturing will govern risk assets for the time being and outweigh the heavy emphasis the Ph.D. community places on the consumer and a services-driven economy for now.

When you marry all of this with corporate earnings season that is now half-way complete, with the exception of Facebook (NYSE:FB), not one icon company has had a good print or said something truly positive in the outlook. In fact, AAPL is very close to touching its 200-week moving average like Russell 2000 and Transports. The last time that happened was during the GFC.

Finally, Friday was month-end and the bulls will lose the call for further pension re-balancing that showed equities were very large to buy. The risk now, with all of the oversold conditions worked off, is that the S&P 500 resumes its downtrend and like every other risk asset the 200-week moving average of 1704 is a magnet.

Interest Rate Probability Dispersion Post-FOMC:

  • Hike Twice March AND June: 6%
  • Hike Once March OR June: 36%
  • NO Hike At All by June: 58%

Rareview Macro is the publisher of “Sight Beyond Sight“, a subscription-based advisory service for professional investors, hedge funds and self-directed investors and offers actionable trade ideas using futures, options, and ETFs within the framework of a disciplined analysis process. Author Neil Azous publishes intra-day updates re model portfolio and trade posts via Twitter @rareviewmacro


 

paris risk

Financial Markets Ignore Paris Terrorism-At Their Own Risk

Weekend’s Geopolitical Events Are Being Ignored..

MarketsMuse curators have been navigating commentary across the media throughout the weekend in search for the various financial industry pundits and opinionators who might add some context to the terrorism that shook Paris on Friday night. No surprise, we noticed the below opening from hot-off-the-press a.m. commentary from global macro advisory Rareview Macro via their institutional newsletter “Sight Beyond Sight”..

Neil Azous, Rareview Macro

Israeli equities are showing the largest positive risk-adjusted return across regions and assets. Crude Oil is -3% off the overnight highs and now trading flat-to-negative. So what is behind that? One argument is that these asset markets are positively responding to the deal made over the weekend on how to end Syria’s civil war and the adopted timeline that will let opposition groups help draft a constitution and elect a new government by 2017.

A lot of professionals want to believe that the US equity market is also technically oversold. Combine that with some of the global solidarity sketched out above in response to the weekend events in France and the view is that there will be more stability rather than higher volatility today in risk assets.

If you believe that, we have land for sale in Fallujah, Iraq and it’s at half price today. 

For the full analysis expressed by Rareview Macro’s Sight Beyond Sight, please click here

Global Macro: Decomposing the Move in Yields-The Pendulum Swing

Decomposing the Move in Yields…Global Fixed Income Coming Closer to Decoupling from German Bunds

MarketsMuse Global Macro and Fixed Income departments merge to provide insight courtesy of “Sight Beyond Sight”, the must read published by global macro think tank Rareview Macro LLC. Below is the opening extract from 10 June edition.

Neil Azous, Rareview Macro

Firstly, please note this morning’s Model Portfolio Update: Crude Oil, XLU/SPY, IYR/SPY, FXI: As per yesterday’s edition of Sight Beyond Sight, we added to existing long positions in Crude Oil, XLU/SPY and IYR/SPY. The update was broadcast in real time via @RareviewMacro.

Now, on to the day’s primary talking points..

The confidence level in the professional community remains low. The attack on the Dollar-Yen (USD/JPY), which had its largest one-day drop since August 2013, was just another casualty of the search and destroy mission underway in overall asset markets. The fact is that there is no model–valuation, technical, or otherwise–that can handicap the speed and the degree of the backup in global yields. The overriding question remains: “When will global yields stop going up, and when can the rest of fixed income decouple from German Bund leadership?”

Risk-Adjusted Return Monitor Summary & Views Continue reading

Oil ETF Investors Race For The Exits

After pouring more than $6 billion into oil ETFs, investors are looking for a quick exit for two reasons: 1) the oil rebound might take much longer than originally expected and 2) the contango market is becoming an even bigger factor. This MarketsMuse blog update is courtesy of Reuters’ article “Look out OPEC! Oil ETF investors head for exit, risking new slump” with an excerpt below.

Oil investors who amassed a $6 billion long position in exchange traded funds, occupying as much as a third of the U.S. futures market, are now racing for the exit at a near record pace.

Outflows from four of the largest oil-specific exchange traded funds, including the largest U.S. Oil Fund (USO), reached $338 million in two weeks to April 8, according to data from ThomsonReuters Lipper. That is the first two-week outflow since September and the biggest since early 2014, marking a turnaround from heavy inflows in December and January on bets that oil prices would quickly rebound from six-year lows.

If the exodus gathers pace it could signal new pressure on crude oil prices that had begun to stabilize at around $50 a barrel this year following their 60 percent plunge, says John Kilduff, a partner at energy fund Again Capital LLC in New York.

Retail investors may have been “trying to bottom fish and got washed out with the recent new low,” he said.

To continue reading about the possibility of a new oil slump from Reuters, click here

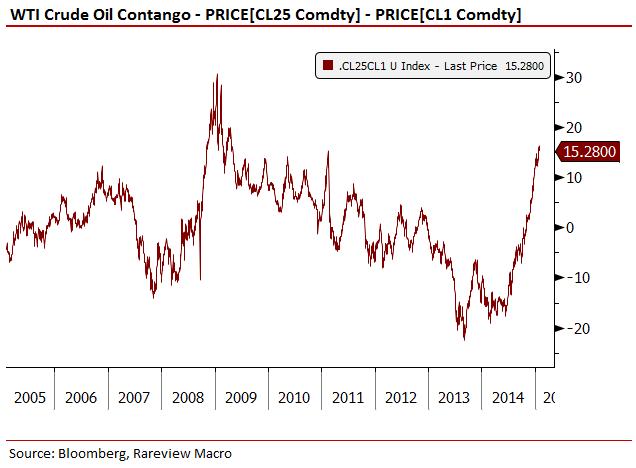
Contango Could Be Killer For Those Who Want Oil Via ETF products

MarketMuse update profiles the close watch oil traders currently have on oil related ETF products such as the DNO or the USL. As investments into oil ETF products have continued to soar, resulting in a more stable oil market price, there is a risk that oil prices could drop and as a result cause people to drown. With more, below is an excerpt from the Globe and Mail article, “Why oil traders are keeping a watch on exchange-traded products”.

Tumult in Libya, U.S. rig counts, production plans of the oil exporting cartel and a pact on nuclear relations with Iran can all affect crude supply and demand, but oil traders have kept an equally close watch on retail investors in recent weeks.

Those investors and hedge funds, betting on a reversal of oil’s long rout, poured billions of dollars into exchange traded products at the tail end of the slide last year, providing unexpected support that helped prices stabilize.

Even as concerns about U.S. storage capacity triggered renewed slide over the past week investors have stuck with the view that a bottom might be in sight, pouring more money into financial products backed by oil futures.

There is a risk, however, that their bets could unravel and send oil prices tumbling again because of a market constellation where spot prices may head lower, but storage bottlenecks make futures contracts months ahead more expensive.

Some market participants warn that if that happens, the U.S. benchmark could slide towards $20 from around $47 now.

Holdings in exchange traded financial products have soared since the beginning of the year, especially highly-leveraged ones such as VelocityShares 3x Long Crude Oil ETN (UWTI). according to data from Morningstar investment research firm.

Reuters analysis of weekly flows data shows investors have been boosting positions in several long funds, while unwinding short positions over the past four weeks.

To read the entire article from the Globe and Mail, click here.

Confused About Crude? You’re Not Alone; Global Macro Traders Tongue-Tied

MarketsMuse excerpt from Feb 3 edition of Rareview Macro LLC’s  Sight Beyond Sight global macro commentary..

Professionals Not Discussing Crude Oil Strength…Short Euro Put on Hold

This is simple.

Neil Azous, Rareview Macro

WTI crude oil is now up ~18% from the January 29th lows. It is not a question of whether the bounce continues or worth debating whether a V-shaped or U-shaped recovery is materializing. What is more important is whether a low was made and a new medium-term range is now being carved out.

Now anyone who monitors cross-market correlation will understand that the price of a barrel of Brent crude oil is highly correlated with the inverse of the trade-weighted dollar. Therefore, if the price of oil is stabilizing there is a quantitative argument that the dollar will stop rising, at least in the short-term.

Professionals are highly sensitive to pattern recognition and the last two times the Euro-Dollar (EUR/USD) corrected (i.e. Oct & Dec 2014) the currency cross appreciated by 2.5-3.2%. This is in line with the current bounce off the low price (i.e. 2.6%) following the ECB meeting in January.

So the question is why is it that those who never participated in the first place or those that reduced their long dollar exposure at the end of 2014 and missed the January QE move, but believe the currency cross will trade down to parity (i.e. 100) by the end of this year, have not used this bounce to get short of EUR/USD, especially considering you now have policy confirmation from the ECB? Continue reading

Crude Oil, Contango and Confusion; Global Macro View

MarketsMuse provides below extracts from Feb 2 edition of Rareview Macro’s Sight Beyond Sight as a courtesy to our readers. The entire edition of today’s SBS newsletter is available via the link below.

Neil Azous, Rareview Macro

Professionals Taking Move in Crude Oil Seriously…Concern Over Deeper Move Lower in Risk

  • No One Prepared for Deflation Risk to Subside
  • Left Tail Risk:  Removing Two Key Peg Break Conversations (for today)
  • China-Korea-Japan Battle – KRW/JPY Hedge
  • Switzerland – Update
  • Model Portfolio Update – January 30, 2015 COB:  -0.33% WTD, -0.88% MTD, -0.88% YTD

No One Prepared for Deflation Risk to Subside Continue reading

CDS Market Says: “How Crude” 1:3 Chance of Russian Default; Mining For Gold ETFs in Them Thar Hills

Below extract courtesy of global macro trading think tank Rareview Macro LLC ‘s  Jan 13 edition of daily commentary via “Sight Beyond Sight”

Neil Azous, Rareview Macro

To Russia Without Much Love: Crude Catalyst and Credit Impact

With another day of lower Crude Oil prices, the vice-grip on the Russian Federation continues to be tightened.

The 5-year credit default swap (CDS) spread has widened out to a new high today and the default probability has increased too slightly above ~34%. In November, there was just a 1 in 5 chance of default. In December, there was just a 1 in 4 chance of default. In January, there is now a 1 in 3 chance of default. The Rubble Basket (symbol: RUBBASK) is above 70.00. It has only traded with a “70 handle” during the height of the December 15-18th currency crisis.

With interest rates above 17% and a continuing effort to defend the Rubble exchange rate, the Russian credit market remains the release valve for stress. This should not be a surprise given that Fitch joined S&P last week in lowering its credit rating to BBB-, the lowest level before junk.

As a reminder, at the end of December, S&P put the country on credit watch negative and has 90-days to act. However, in its press release on December 30th the ratings agency said that it aims to resolve its corporate debt ratings by the end of January, after it makes a decision on the sovereign grade. Given the continued breakdown in the Crude Oil price, speculators are increasingly sensitive to the fact that S&P could very soon be the first rating agency to lower Russia to high yield.

Gold Miners:  Quick Update: GDX & GFI Could Gain Continue reading

Backdoor Way to Hedge Crude Oil Bounce; Exiting China: A Very Rareview

Below fast market update courtesy of Rareview Macro LLC a.m. edition of global macro strategy commentary “Sight Beyond Sight”; MarketsMuse is re-publishing this extract no more than 10 minutes of current subscribers receipt..Our thanks to the folks at Rareview!
• New Position: Long Canadian Dollar versus Short Swiss Franc (CAD/CHF)
• Existing Position: iShares China Large-Cap ETF (FXI) Now Above Strike Price

Something very illuminating appeared on our risk-adjusted return monitor today.

Neil Azous, Rareview Macro

After reading the tea leaves, the conclusion we have drawn from it points to a trend that will have meaningful global repercussions – and will also provide the basis for an investment and hedging opportunity.

Additionally, while everyone else is focused on the weakness in the Euro exchange rate (i.e. the ECB EUR/USD fix on January 4, 1999 was 1.1789 vs. last price 1.1782 ECB Statistical Data Warehouse), or else trying to figure out whether the S&P 500 is half-way through a V-shaped recovery and the bounce is actually tradable, this is genuinely a “Rareview” – one that has not been widely observed in the market yet.

See the below illustration. In yesterday’s edition of Sight Beyond Sight, we highlighted that the release of the latest data on Switzerland’s Foreign Currency Reserves showed thelargest rise since mid-2012 when ECB President Mario Draghi famously said “we will do whatever it takes” to save the euro. Specifically, FX reserves were 495.1 bln vs. 472.0 bln estimated vs. 462.7 bln previously. Put another way, they ended up rising by 32.4 bln versus the expected 9.3 bln. A forecast missing by 23.1 bln is, to put it mildly, a significant event and one that highlights the degree of flight to quality away from Russia in mid-December.

Continue reading

Most Professional Investors Headed The Wrong Way First: A Global Macro Strategy View

MarketsMuse editor note: below insight courtesy of Rareview Macro LLC’s global macro strategy newsletter “Sight Beyond Sight” is a great read for investment professionals who want to start off 2015 on the right leg.


Neil Azous, Rareview Macro

Wrong Way First (“WWF”) Trading

An astute market practitioner that we are fond of once coined the trading phrase “Wrong Way First” (“WWF”). WWF refers to the risk the professional investment community is exposed to at the beginning of every New Year – that is, the first trade will be a reversal in the consensus positioning and inflict severe PnL duress.

While it is true that substantial wealth is only really created over time (i.e. by investing), the money management business is beholden to the Gregorian calendar and that means performance resets at the close of business on December 31st. Put another way, if you manage money for a living you’re only as good as your last best trade.

Therefore it should be of little surprise that professionals begin each January more focused on not getting caught up in a New Year’s malaise rather than trying to take advantage of opportunities by adding new risk or pressing 2014 positions. The memory of last January, a month which included the unwind of the long Japanese Nikkei and Chinese Yuan carry trade strategies and inflicted severe PnL duress, is still too fresh to forget. This is especially true considering it took the macro strategy six months to climb out of its negative PnL hole and it was only saved when the US Dollar theme sent down a ladder to climb up.

While there are many key discussions underway to start 2015 it is important to highlight that the dominant theme emerging from our discussions with any risk takers is concern over a WWF trading theme materializing. Such is the nature of this business, especially for absolute return strategies.

Our interpretation of these conversations is that the tolerance level to withstand PnL duress around any theme that is currently at a momentum and sentiment extreme – such as long Equities, fixed income duration, and the US Dollar, short Crude Oil, and underweight Emerging Markets – is very low.

As way of background if you apply this theme to actual positioning it reveals that the top WWF candidates across the major asset classes are: Continue reading

Record Amounts Flow Into Energy-Related ETFs

MarketMuse update courtesy of extract from Bloomberg’s Jim Polson

Bargain-seeking investors have turned bullish on embattled energy stocks, plowing record amounts into the industry.

More than $3.13 billion went into exchange-traded funds holding stakes in Exxon Mobil Corp. (XOM)Schlumberger Ltd. (SLB)and other energy stocks this month, even as the price of oil fell 22 percent, according to data compiled by Bloomberg. That’s four times the average for the year and more than the prior record in December 2007, when oil was trading near $91 a barrel.

“There definitely seems to be evidence of investors seeking to bottom-fish this market and pre-position for 2015,” David Mazza, head of ETF research at State Street Corp., said in a phone interview. “Some investors we’ve spoken with don’t believe the negative picture on energy that’s become consensus.”

Investors are betting on a higher long-term price for crude oil. Brent, the global benchmark, has traded around $60 a barrel since mid-month, after dropping by half from its June high. A stabilization in futures prices since Dec. 15 has helped energy stocks rebound for the past two weeks.

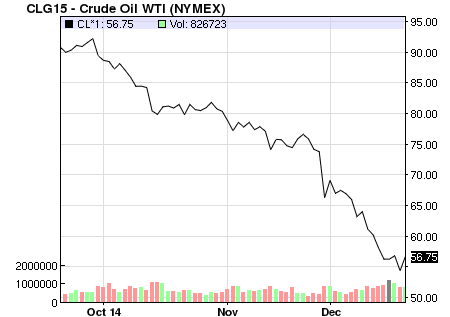
Oil slipped to a five-year low of $56.74 in London. Brent futures have plunged 51 percent from their June high.

“Longer-term investors, two to three years from now, will look back on this and say, ‘God, that was a good buying opportunity,’” said Fadel Gheit, a New York-based energy analyst for Oppenheimer & Co. For short-term investors, “it’s not going to be very pretty for the next few months.”

ETFs are increasingly seen as a bellwether of investor sentiment because they allow broad bets across a sector with lower transaction costs than buying individual stocks. Year-to-date, energy ETFs have attracted $9.25 billion of new money, the most of any sector behind real estate funds and more than triple the same period in 2013.

For Jim Polson’s entire article from Bloomberg, click here

Crude Oil: An Objective View From Rareview: Let’s Not Be Franc

Below excerpt is courtesy of today’s Rareview Macro a.m. edition of global macro strategy commentary “Sight Beyond Sight”…

Crude Oil

The professional community is honing in on to two crude oil observations overnight – one “temporary” and one “transitory”.

  • Ali Al-Naimi, Saudi Arabia’s oil minister, said the global economic slowdown has contributed to a temporary “problem” in the market. (Source: Saudi Press Agency report)
  • The Federal Reserve said it views the decline in the energy price as “transitory” which was forcefully reiterated many times during Chairwoman Janet Yellen’s press conference.
Neil Azous, Rareview Macro

Here is a dirty framework to work with before you all get excited about this. Please note, this analysis is completely neutral as we have no axe to grind when it comes to Crude Oil and have not speculated in anything related to the black stuff for months. So the view is objective.

WTI is up 3-days in a row or 3.5%. Yesterday, it was up $3 but closed flat. At one point today it was up $2.26 and it is now only up $1.22.

Brent is up 2-days in a row 4.58%. Yesterday, it was up ~$3 but closed largely flat. At one point today it was ~$3 and is up only $1.62.

Simply put there are two kinds of bets professionals make when a historical event materializes, such as that we have just witnessed in crude oil. Continue reading

Black Gold v. Yellow Metal: Macro-Strategy Perspective

As if it were a segment in “Orange is the New Black,” the price correlation between Crude Oil (aka Black Gold) and the Yellow Metal continues to swing like a chandelier in a windy mansion. Below extract courtesy of Neil Azous, from today’s a.m. edition of Rareview Macro’s Sight Beyond Sight summarizes the current correlation in a crisp way…

Neil Azous, Rareview Macro LLC

There are two assets being watched closely right now – Brent Crude Oil and the Euro Exchange Rate.

Firstly, Brent Crude Oil is showing the largest negative risk-adjusted return in Commodities. This morning, the “barrel” has broken through yesterday’s low and overall has now retraced over 50% of the Iraq/ISIS move higher seen in June. Below is a regression analysis between Brent Crude Oil and Gold for three time periods related to Iraq/ISIS: Before, Height, and Current.

Gold was trading at its lower point on June 2nd and the correlation (i.e. red asterisk on chart) to Brent Crude Oil was negative. On June 19th, the correlation was the most positive when Brent Crude Oil was at its highest level. Today, the correlation is on the cusp of swinging back to negative territory. We highlight this because the same pattern has been seen before, with the height on March 14th and after the Ukraine-Russia crisis. And what happened next? Gold dropped by -10% over the next 45 days.

By the way, it was reported that assets in the SPDR Gold Trust (symbol: GLD) rose +1.4% to 796.39 metric tons in the two sessions through yesterday. To put that in context, that is the largest two-day gain since November 2011 and it is just one example of the new found retail length in Gold. The other was in CFTC futures positioning which professionals use to gain exposure. Continue reading