Tag Archives: exchange-traded funds

J.P. Morgan War On Hacking Boosts ETF $ HACK

MarketMuse update courtesy of Yahoo Finance from ETF Trends. 

Earlier in the week, MarketMuse profiled cyber security ETFs recent boost and today, Brokerdealer.com profiled how J.P. Morgan’s war on cyber security is costing bankers’ jobs, so it only seemed fitting that MarketMuse combine to two subjects for today’s MarketMuse post. Since the threat of cyber security doesn’t seem to be going away anytime soon, J.P. Morgan is spending more money on cyber security protection and less money investors’ salaries resulting in the lowest banker hiring rate in recent years and growing cyber security ETFs.   

In what has become an almost daily affair in recent weeks, the PureFunds ISE Cyber Security ETF (HACK) is hitting record highs again Thursday and doing so on strong volume.

HACK, the first exchange traded fund dedicated to the cyber security industry, is up 1% today on volume that is already 36% above the daily average. As has been the case with HACK over its brief trading history (the ETF debuted in November), the catalysts for Thursday upside are easy to identify.

Namely, a Bloomberg article detailing J.P. Morgan Chase’s (JPM) commitment to bolstering its cyber security through increased spending and hiring of former military members. The bank was victimized by a cyber security breach in June 2014.

Given HACK’s penchant for responding favorably to such news items (see the controversy surrounding “The Interview” and the ETF’s reaction to the recent Anthem Blue Cross hack), it is not a stretch to say that if HACK was around in June, it would have soared in the days following news of the J.P. Morgan hack. [Anthem Hack Lifts Cyber Security ETF]

HACK did not exist in June 2014, but J.P. Morgan is having a favorable impact on the ETF. In October 2014, J.P. Morgan Chase (JPM) CEO Jamie Dimon said the banking giant will likely double its cyber security spending to $500 million within the next five years.

Important to HACK, Dimon is making good on that promise. J.P. Morgan’s security operation has 1,000 staffers, double the size of the comparable unit at Google (GOOG), according to Bloomberg. Add to that, J.P. Morgan is far from the only major financial services that is expected to increase cyber security spending in the coming years.

Citigroup’s (NYSE: C) cyber security budget jumped to $300 million at the end of last year while Wells Fargo (WFC) spends roughly $250 million a year on cybersecurity and has increased staffing in the area by 50%, according to the Wall Street Journal.

Increased cyber security spending by financial services firms is seen as a boon for companies such as FireEye (FEYE), Palo Alto Networks (PANW) and Japan’s Trend Micro. All three are members of HACK’s portfolio with FIreEye and Palo Alto Networks combining for 9.7% of the ETF’s weight.

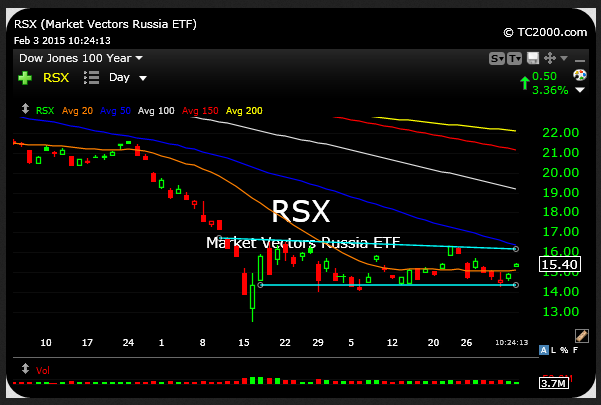
Earlier this week, HACK surged after Russia’s Kaspersky Lab, a major cyber security firm, said a group of hackers have stolen as much as $1 billion from over 100 banks in 30 countries since late 2013.

Investors are buying into the thesis that increased cyber security spending bodes well for HACK’s longer-term potential. The ETF that the fund is now home to $231 million in assets under management, confirming HACK’s place on the list of most successful ETFs to debut in 2014. Impressively, HACK’s ascent to $231 million in AUM means the ETF has more than doubled in size over the past six weeks after topping $100 million in assets in early January. The ETF debuted in November.

For the original article, click here.

Should You Have An All-ETF Portfolio? Betterment CEO Has An Answer

MarketMuse update is courtesy of CNBC. CEO and Founder of Betterment , Jon Stein, offered his commentary on this issue to CNBC. Betterment is an automated investing service that provides optimized investment returns for individual, IRA, Roth IRA & rollover 401(k) accounts.

There’s a natural progression in the way the public responds to innovation. Something that first seems like a mere novelty becomes an interesting new niche, then a great idea and then, “How did we ever get along without this?”

In financial services, exchange-traded funds are somewhere around the third or fourth stage, between new niche and great idea. ETFs attracted more net investment last year ($239 billion) than did mutual funds ($225 billion), according to data from Morningstar. Five years earlier the net inflow into mutual funds was more than triple the net amount invested in ETFs.

In the last five years, the public’s affinity for ETFs raised assets under ETF management by 152 percent, to $2 trillion, up from $793 billion. Mutual fund assets only rose 53 percent during the same period.

Faster and cheaper information system infrastructure has helped the growth of ETFs. In my view, ETF portfolios will be the inevitable default for investors in the years to come because they are lower cost, more transparent and offer greater liquidity and tax advantages than mutual funds. Already, the increasing number of assets invested with automated investing services, which use all-ETF portfolios, underscores this shift.

Lower cost

By passively and systematically tracking an index, ETFs are far cheaper to run than most actively managed mutual funds that employ portfolio managers and analysts to select securities. That research costs money, and so does the frequent trading that’s common in such funds—they call it “active management” for a reason—not to mention the buying and selling of fund shares themselves, transactions that always involve the fund provider.

More transparent

ETFs also feature greater transparency. Their underlying portfolios change more rarely because the indexes that they’re based on generally maintain stable lists of components. The high turnover of many mutual funds and the fact that their holdings are reported only four times a year can make it difficult for shareholders to know exactly what they’re holding.

It’s not just the specific securities that can keep mutual fund investors in the dark. The broad nature of the fund itself can become obscured by what’s called “style drift.” Say growth is outperforming value; the managers of value funds, consciously or not, may start tilting toward more growth-oriented stocks.

Depending on what else they own, shareholders may become overweight in growth stocks and not even know it. By contrast, a value-stock ETF will hold value stocks no matter what.

ETFs are more transparent in another sense. The very low expenses and commoditized nature of ETFs make commissions and “kickbacks” to brokers or retirement-plan sponsors impractical. So if an ETF is recommended by an advisor or made available by a broker or retirement-plan sponsor, it’s likely to be an unbiased recommendation.

For the complete article from CNBC, click here

Take A Drag Or Sip Out Of These Industries: Smoke and Alcohol ETFs Are Hot

MarketMuse update is courtesy of Bloomberg’s Justin Fox. It is very difficult to invest stocks for long term, humans’ interests are always changing and that affects the stock market. Bloomberg’s Justin Fox suggests that people should invest in human behaviors such as the tobacco and alcohol industries, such as the tobacco sector big name, Philip Morris International Inc., PM or popular alcohol ETF,  Constellation Brands Inc., STZ. He explains that unless these products are banned, humans will always have an interest.

It would be really cool to know which industries are going to thrive and grow and create jobs in the future. It’s also really hard to figure that out ahead of time. If you’re just interested in which industries will deliver the best stock-market returns, though, history seems to point to an easy shortcut — invest in companies that sell addictive stuff.

I learned this dubious lesson by reading, in quick succession, two big new reports: the Brookings Institution’s analysis of the 50 “Advanced Industries” that are supposed to drive job and income growth in the U.S., and Credit Suisse’s annual “Global Investment Returns Yearbook.” The Brookings report tries to look into the future by measuring investment in technological progress by industry — and although most of the 50 advanced industries it identifies are what you would expect, there are some surprises. In the 2015 Credit Suisse yearbook, meanwhile, Elroy Dimson, Paul Marsh and Mike Staunton of London Business School examine 115 years of stock-market returns by industry, and while they document a lot of technological upheaval, the two biggest winners for investors turn out to be decidedly low tech.

An advanced industry, by Brookings’ accounting, is one “in which R&D spending per worker reaches the top 20 percent of all industries and the share of workers with significant STEM knowledge exceeds the national average.” (STEM = science, technology, engineering and math. And R&D = research and development. But you probably knew that.) There’s lots of research showing that technological change drives economic growth, and R&D spending and STEM knowledge are supposed to be proxies for future technological change.

I don’t know of any obviously better proxies, but the results show the difficulty of any such accounting. The list of the very biggest R&D spenders isn’t particularly surprising:-1x-1

Dig deeper into the advanced industries list, though, and you soon come across industries that don’t seem all that advanced: railroad rolling stock, foundries, petroleum and coal products, metal-ore mining. Are these secret hotbeds of technological change that should command more attention? Probably not. One old-school industry, motor-vehicle manufacturing, does spend a ton on R&D ($48,461 per worker), but those others made the list mainly because there just aren’t that many industries in the U.S. that invest in R&D at all. To get to 50, you have to include a bunch of industries with per-worker spending of less than $5,000 a year. (No. 50, in case you’re wondering, is wireless-telecommunication carriers — which spent just $455 per worker in 2009.)

This isn’t necessarily a problem for the U.S. economy. One thing you’ll notice if you spend any time with the North American Industry Classification System is that it’s backward-looking. Older parts of the economy are divided into lots and lots of industries; newer ones aren’t. So you get railroad rolling-stock manufacturing, which employed 25,200 people in 2013 and generated $3.6 billion in output, counted as an industry on the same level as computer-systems design, which employed 1.7 million people and generated $246 billion.

Yet it’s these newer industries that generate the growth — at least, they have over the past 115 years. In 1900, according to the Credit Suisse yearbook, railroads accounted for 63 percent of stock-market value in the U.S. Now they’re less than 1 percent, and 62 percent of U.S. stock-market value is in industries that were small or nonexistent in 1900. The largest industries by market cap now are technology, oil and gas, banking and health care.

We’re all supposed to believe that past performance is no guarantee of future results. But given human nature, it seems reasonable to expect tobacco and alcohol to continue to do well — unless tobacco is completely banned, of course. Picking the next hot industry is a much harder task, yet it is a much more important one.

For the entire article, click here.


Threat Of Hackers Grows And So Does Cyber Security ETFs

MarketMuse update courtesy of Todd Shriber of ETF Trends, profiles the increase in cyber security ETFs as the threats of being hacked become more and more relevant.

The PureFunds ISE Cyber Security ETF (NYSEArca: HACKcontinues to cement its status as a legitimate event-driven exchange traded fund.

HACK is higher by 0.7% Tuesday on volume that is already more than quadruple the daily average after Russia’s Kaspersky Lab, a major cyber security firm, said a group of hackers have stolen as much as $1 billion from over 100 banks in 30 countries since late 2013.

Various media outlets are reporting those hackers are more interested in financial gain than pilfering personal information from the banks’ customers. That point is unlikely to assuage the banks or their customers, but it is enough to have HACK trading at record highs for the second consecutive session.

HACK’s Tuesday momentum is carrying over from last Friday when the ETF soared to a record high on volume of nearly 1.4 million shares as President Obama hosted the first-ever cyber security summit, which featured luminaries from throughout the tech industry, including Apple (NasdaqGS: AAPL) CEO Tim Cook.

Importantly, most of the action in HACK last Friday was of the bullish variety. So intense was buying activity in the ETF that the fund is now home to $231 million in assets under management, confirming HACK’s place on the list of most successful ETFs to debut in 2014. Impressively, HACK’s ascent to $231 million in AUM means the ETF has more than doubled in size over the past six weeks after topping $100 million in assets in early January. The ETF debuted in November.

News of the $1 billion bank hack, while positive for HACK in the near-term, also serves as reminder of the long-term opportunity with the ETF because the financial services industry is expected to be one of the largest spenders on cyber security enhancements in the coming years.

In October 2014, J.P. Morgan Chase (NYSE: JPM) CEO Jamie Dimon said the banking giant will likely double its cyber security spending to $500 million within the next five years.

HACK benchmarks to the ISE Cyber Security Index, “which tracks the performance of companies actively engaged in providing services for cyber security and for which cyber security business activities are a key driver of their business model. These cyber security services are designed to protect computer hardware, software, networks and data from unauthorized access, vulnerabilities, attacks and other security breaches,” according to PureFunds.


PIIGS Bring Home the Bacon For The Eurozone

MarketMuse update is courtesy of Tom Lydon from ETF Trends. 

Continuing with what has turned out to be exhausting coverage of European ETFs, the Portuguese, Irish, Italian, Spanish and Greek stocks (the PIIGS) ETFs are showing a bright immediate future for the Eurozone. 

Though still controversial, due in part to looming speculation that Greece could potentially depart the Eurozone, exchange traded funds tracking Portuguese, Irish, Italian, Spanish and Greek stocks (the PIIGS) have the look of value propositions.

Even with Greece’s change in government, one that threatens the country’s ability to pay its debts, meet funding needs and could hasten the country’s Eurozone departure, the Global X FTSE Greece 20 ETF (NYSEArca:GREK) has mustered a small year-to-date gain.

Earlier this month, Standard & Poor’s pared its rating on Greece’s sovereign debt to B- from B. The ratings agency is keeping the long- and short-term ratings on Greece on CreditWatch with negative implications. Greece’s B- rating is just one notch above CCC, a rating that implies vulnerability to nonpayment “and is dependent upon favorable business, financial, and economic conditions for the obligor to meet its financial commitment on the obligation,” according to S&P, scenarios that Greece is unlikely to meet in the near-term.

The iShares MSCI Italy Capped ETF (NYSEArca: EWI) and the iShares MSCI Ireland Capped ETF (NYSEArca: EIRL), often seen as the steadiest hand of the five PIIGS ETFs, have been far more alluring than GREK this year. EWI and EIRL are up an average of 6.5% with average volatility of about27%. GREK is up about 2% with 93% volatility.

Investors looking for exposure to multiple PIIGS through the convenience of one ETF that emphasizes value investing can turn to the actively managed Cambria Global Value ETF (NYSEArca: GVAL).

Cambria’s Mebane Faber “Faber employs a statistic called the Cyclically Adjusted Price-Earnings (CAPE) ratio to evaluate countries. First developed by Nobel Prize winner Robert Shiller, the CAPE has proven effective at predicting the future performance of U.S. stocks. The lower the ratio is, the higher the expected return. Faber has applied the CAPE to other countries in his own research. Examining a period from 1980 through 2013, he found that those countries’ markets with a CAPE below seven subsequently produced a 14.4% 10-year annualized return while those with the highest CAPE above 45 produced only 1.2%,” reports Lewis Braham for Barron’s.

GVAL targets the cheapest, most liquid picks in countries where political or economic crisis have depressed valuations. GVAL’s eligible country universe includes Greece, Russia, Hungary, Ireland, Spain, Czech Republic, Italy and Portugal.

At the end of 2014, the five PIIGS member nations combined for 46% of GVAL’s weight,according to Cambria data.

Portugal’s CAPE is 7.7, Italy’s 9.6, Ireland and Spain about 11. The U.S.’s, by contrast, is 27, according to Barron’s.

Helped by its PIIGS exposure and what was an 8% weight to suddenly resurgent Russian stocks at the end of last year, GVAL is up 6.4% over the past month, giving the ETF an advantage of 60 basis points over the iShares MSCI ACWI ex U.S. ETF (NasdaqGM: ACWX).

For the original article from ETF Trends, click here

German ETFs Offer Good Opportunities in Rebounding European Market

MarketMuse update is courtesy of ETF Trends’ Todd Shriber.

Earlier this week and over the past few months, MarketMuse has been covering the rocky European market, thanks to Greece, and its recent rebound, with ETF $GVAL. Now investors have even more to be excited about with the recent success of German ETFs. 

The U.S. is not the only developed market where stocks are eying record highs. Germany’s benchmark DAX accomplished that feat Friday, climbing above 11,000 for the first time.

Exchange traded fund investors are responding, pumping massive of amounts of capital into Germany ETFs. The Recon Capital DAX Germany ETF (NasdaqGM:DAX), the only U.S.-listed DAX-tracking ETF, is up nearly 8% in the past month.

With its heavy tilt toward large, multi-national companies, the DAX index is benefiting from a depreciating euro currency. A weaker euro would help support export growth and potentially generate greater revenue from overseas operations for the multi-nationals.

A weak euro and sturdy data out of the Eurozone’s largest economy is prompting investors to put new capital to work with Germany ETFs. Through Thursday, only three ETFs have seen greater inflows than the $494.1 million added to the iShares MSCI Germany ETF (NYSEArca: EWG), the largest Germany ETF.

One of those three is the WisdomTree Europe Hedged Equity Fund (NYSEArca:HEDJ), which allocates 26% of its weight to German stocks. No ETF has seen larger 2015 inflows than HEDJ’s $4.1 billion in new assets and the gap between HEDJ and the second-place inflows ETF, the SPDR Gold Shares (NYSEArca: GLD), is sizable at over $1.6 billion.

Thanks to the faltering euro, investors are also flocking to currency hedged Germany ETFs. After taking in $450 million on Thursday, the iShares Currency Hedged MSCI Germany ETF (NYSEArca: HEWG) has added over $491 million this week. The ETF, which uses EWG with a EUR/USD hedge, had $287.4 million in assets heading into Thursday.

On a percentage basis, the Deutsche X-trackers MSCI Germany Hedged Equity Fund (NYSEArca: DBGR) and the WisdomTree Germany Hedged Equity Fund (NasdaqGM: DXGE) have also seen significant asset growth. DXGE has more than doubled in size this year while DBGR has tripled in size since the start of 2014.

Underscoring the advantage of the euro hedge with German equities, DBGR and DXGE have both produced double-digit returns over the past month while EWG is up “just” 7.5%. Importantly, economic data supports the case for more upside for Germany ETFs,

“German gross domestic product expanded 0.7 percent in the fourth quarter, soaring past an estimate for 0.3 percent. Private consumption rose markedly in the fourth quarter, and investment developed positively, driven by a significant increase in construction output,” reports Inyoung Hwang for Bloomberg.


Take A Bite Out of This Apple: Tech ETF Surges Off Of Apple’s Success

MarketMuse update is courtesy of ETF Trends’ Tom Lydon

Shares of Apple (NasdaqGS: AAPL) are up a modest by the stock’s standards 0.6% today, pushing the iPhone maker’s market capitalization to a lofty $732 billion and some change.

As has been well-documented, Apple’s ascent to becoming the first company with a market value of $700 billion and its targeting of the unheard of $1 trillion stratosphere is benefiting plenty of exchange traded funds. One of those ETFs is the Fidelity MSCI Information Technology Index ETF (NYSEArca: FTEC).

FTEC is one of the newer kids on the sector ETF block, having debuted in October 2013 as part of Fidelity’s 10-ETF sector suite. That group has since grown by one with the recent addition of theFidelity MSCI Real Estate Index ETF (NYSEArca: FREL).

Fidelity has navigated the ultra-competitive sector ETF landscape with success. In June 2014, Fidelity’s original 10 sector ETFs had a combined $1 billion in assets under management, a number that has since more than doubled to $2.2 billion.

FTEC has been a primary driver of Fidelity’s sector ETF growth. At the end of January, the ETF had $352.6 million in assets under management, good for the second-best total among Fidelity sector ETFs behind the Fidelity MSCI Health Care Index ETF (NYSEArca: FHLC).

In an environment where Apple has more than restored its juggernaut status, FTEC earns its place in the Apple ETF conversation with a weight of 17.1% to the iPad maker. That is more than double FTEC’s weight to Microsoft (NasdaqGS: MSFT), its second-largest holding.

FTEC’s Apple weight of 17.1% also exceeds the weight to that stock found in one of the fund’s primary rivals, the Vanguard Information Technology ETF (NYSEArca: VGT).Unlike rival ETF issuers, Vanguard does not update its funds’ holdings on a daily basis, opting to do so once a month. VGT’s latest holdings update, from Dec. 31, 2014, showsan Apple weight of 15.3%. With the stock’s 14.5% gain this year, VGT’s Apple exposure is now likely well over 16%.

FTEC and VGT compete for the affections of cost-conscious investors as both charge just 0.12% per year, making the pair the least expensive tech sector ETFs on the market. Each has returned 2.1% year-to-date.

Like its rivals, FTEC is a cap-weighted ETF, meaning as Apple’s market value rises, the stock’s presence in FTEC grows. Since the start of December, FTEC’s Apple weight has increased by 140 basis points.

“FTEC offers more exposure to semiconductors and data processing & outsourced services companies and no exposure to integrated telecom services stocks,” according to S&P Capital IQ, which rates the ETF overweight.

Will Investors Buy Into The Latest Buyback ETF? A Look at $SPYB

MarketsMuse update profiles last week’s launch of the SPDR S&P Buyback ETF, an exchange-traded fund focused on tracking the stock price performance of companies that are in midst of corporate share repurchase (10b-18) programs. Excerpt courtesy of ETF Daily News.

Buybacks and dividends have been among the primary contributors to the stock market Bull Run. In fact, share buybacks in the third quarter amounted to $143.4 billion – the fourth highest quarter for spending on buybacks by S&P 500 companies since 2005.

This massive surge in spending by U.S. companies on share buybacks has prompted issuers for launching new products targeting this space. State Street has recently launched a product that would tap companies having a high buyback ratio.

The product – SPDR S&P 500 Buyback ETF – was launched on February 4 and trades under the ticker SPYB. Below we have highlighted some of the details about the newly launched fund.

SPYB in Focus

The ETF looks to track the performance of the S&P 500 Buyback Index, which provides exposure to 101 companies in the S&P 500 with the highest buyback ratio in the last 12 months. The index follows an equal weighted strategy and is rebalanced quarterly. The equal weighted strategy ensures that the index’s assets are quite well diversified with none of the individual holdings having more than 1.2% exposure in the fund.

Tesoro Corporation, Kohl’s Corporation and MeadWestvaco Corporation    are the top three holdings of the fund. Sector-wise, Consumer Discretionary takes the top spot with a little less than one-fourth of fund assets, followed by Technology and Industrials with 18.2% and 16.3% exposure each..

The index currently has a dividend yield of 1.47%, while the fund charges 35 basis points as fees.

How does it fit in a portfolio?

Though most investors prefer dividends to buybacks as they allow investors to get the cash immediately, a buyback has its own set of advantages. Buybacks reduce the outstanding share count and thus increase earnings per share. Further, they are more tax efficient than a special dividend.

Per Fact Sheet, U.S. share buyback increased 16% year over year and 6.6% quarter over quarter during the third quarter of 2014. Moreover, U.S. companies are currently sitting on a record amount of cash, which might encourage the companies to continue to be active on the share buyback front.

For the entire story from ETF Daily News, please click here

Catch Europe’s Rebound With $GVAL ETF

MarketMuse update profiling Europe’s market rebounding is courtesy of ETF Trends’ Tom Lydon

With Greece seemingly in the headlines every day, and rarely with good news, it is easy for investors to perceive European equities as damaged and vulnerable to more declines.

On the brighter side of the ledger, history is littered with examples that highlight the profitability of contrarian investing and buying when others are fearful. Enter the Cambria Global Value ETF (NYSEArca: GVAL).

GVAL debuted in March to 2014 and to say the ETF was the victim of inauspicious timing is to understate matters. While an ideal way to gain access to some attractively valued developed European markets, GVAL also features ample emerging markets exposure. Neither emerging nor non-U.S. developed markets were the places to be soon after GVAL debuted.

“GVAL has gotten off to a humble start. But if you’re a believer in value investing as a discipline, then GVAL deserves a serious look. In a market in which the U.S. has outpaced its foreign competitors for years, I consider GVAL to be an excellent, diversified rebound play on Europe and emerging markets,” according to Charles Sizemore.

GVAL’s current emerging markets exposure among its top 10 country weights does not lack for controversy. Brazilian stocks, embroiled in a graft controversy surrounding Petrobras (NYSE: PBR), made up 12% of GVAL’s weight at the end of the fourth quarter. Russia and Greece, rarely deliverers of good news, combined for another 14% of GVAL at the end of 2014, according to Cambria data.

“But herein lies the beauty of GVAL. Few investors would have thick enough skin to take a large position in any of these countries individually. But even investors with nerves of steel would have trouble building a viable portfolio of stocks from most of these markets due to the lack of available U.S.-traded ADRs to buy.   Very few investors have access to the small and mid-cap foreign stocks that dominate GVAL’s portfolio,” notes Sizemore.

The actively managed GVAL targets the cheapest, most liquid picks in countries where political or economic crisis have depressed valuations. GVAL’s eligible country universe includes Greece, Russia, Hungary, Ireland, Spain, Czech Republic, Italy and Portugal. At the end of 2014, 56% of the ETF’s country weight was allocated to Eurozone nations.

Investors can also access a sliver of GVAL via the Cambria Global Asset Allocation ETF (NYSEArca: GAA). Known as the ETF without an annual fee, GAA debuted in December and holds other ETFs. At the time of launched, GAA held a 4% weight to GVAL.

Currency-Hedged ETFs In Demand by Global Macro-Focused Traders

MarketsMuse update courtesy of reporting by Reuters’ Gertrude Chavez-Dreyfuss and Ashley Lau

NEW YORK (Reuters) – U.S. investors spooked by wild swings in the foreign exchange market are piling into exchange-traded funds that strip out the local currency on their international equity portfolios, making them one of the most sought-after financial products in 2015.

With the dollar having rallied more than 19 percent since the beginning of 2014, investors are seeing gains in overseas stock markets eaten up by losses against the greenback.

“People are voting with their feet,” said Luciano Siracusano, chief investment strategist for WisdomTree Investments in New York. “They’re putting billions of dollars into these funds, and what they’re saying is, ‘We don’t want to be 100 percent unhedged.’”

Some say there aren’t enough of these products for investors looking for international exposure. These ETFs have about $31.5 billion in assets, up nearly five-fold from 2011. But assets in international equity ETFs exceed $275 billion, according to WisdomTree.

“There are 40 countries with stock markets deep enough to have a currency-hedged product,” said David Kotok, chairman and chief investment officer of Cumberland Advisors in Sarasota, Florida, which oversees $2 billion, and whose firm’s equity investments are solely through ETFs. Continue reading

Greece ETF Crumbles to Ruins

MarketMuse update is courtesy of Business Insider’s Sam Ro

MarketMuse has previously reported on the volatility the Greece elections created early this year now even more problems have ensued for the country. Following the the European Central Bank’s announcement that it lifted its waiver on minimum credit rating requirements for marketable instruments issued or guaranteed by Greece, Greece’s ETF crashed leaving just ruins left.

The Greek stock market closed hours ago, but the exchange-traded fund that tracks Greek stocks, GREK, crashed during the final minutes of trading in the US markets.

The euro is also getting walloped, falling 1.3% against the US dollar.

This comes following bad news from the European Central Bank (ECB) to Greece’s debt-laden banks.

Shortly after 3:30 p.m. ET, the ECB announced that it lifted its waiver on minimum credit rating requirements for marketable instruments issued or guaranteed by Greece.

To put it another way, Greek banks can no longer exchange their junk-rated sovereign bonds for cash.

“The waiver allowed these instruments to be used in Eurosystem monetary policy operations despite the fact that they did not fulfill minimum credit rating requirements,” the ECB said in a press release. “The Governing Council decision is based on the fact that it is currently not possible to assume a successful conclusion of the programme review and is in line with existing Eurosystem rules.”

“In other words, the ECB doesn’t see Greece complying with existing bailout rules,” Bloomberg’s Lorcan Roche Kelly explained.

However, it’s not all bad. The ECB has another way for Greek banks to exchange their securities for liquidity. The cost of borrowing will however be higher.

“Liquidity needs of Eurosystem counterparties, for counterparties that do not have sufficient alternative collateral, can be satisfied by the relevant national central bank, by means of emergency liquidity assistance (ELA) within the existing Eurosystem rules,” the ECB said.

“The move from the ECB today is a copy of the suspension of Greek debt that occurred in February 2012,” Kelly noted.

“For Greek banks, this move by the ECB will not directly be a disaster as they have reduced their exposure to the Greek sovereign since 2012 and so are less reliant on that debt as collateral,” Kelly argued.

Still, it appears to be more bad than good. And judging by the reaction in the currency and equity markets, investors and traders were hoping for better.

For the original article, click here.

Mutual Funds Issuer Hoping to Enter the ETF Ring

MarketMuse update courtesy of ETF Trends’ Tom Lydon

American Funds, one of the largest mutual funds issuer, are waiting for the SEC to approve an application for the issuer to enter the ETF industry. 

Capital Group Cos., the parent company of American Funds, submitted an application for ETFs to the SEC a year ago. A notice from the SEC indicates approval of American Funds’ ETF foray appears likely though there is still time for opponents to request an SEC hearing, though such a hearing is unlikely, reports Trevor Hunnicutt for InvestmentNews.

California-based American Funds has $1.2 trillion in assets under management, or more than half the current AUM tally for the U.S. ETF industry. However, ETFs are the fastest-growing corner of the asset management industry, underscoring the desire of mutual fund companies to become involved with products that institutional investors and advisors are increasingly adopting.

While it took nearly two decades for the ETF industry to reach $2 trillion in assets, it will not need nearly as long to get to $5 trillion, according to a new report by PwC. The PwC repots says the global ETF industry will reach $5 trillion in combined AUM by 2020.

News of American Funds potentially entering the ETF business represents a reversal from the company’s previous stance on ETFs. The company has been a strident supporter of active management at a time when data indicate many active managers consistently fail to beat their benchmarks.

In September 2013, Capital Group published a study that “argued that its stock-picking mutual funds outperformed their benchmark indexes in the majority of almost 30,000 periods examined over the past 80 years. That included 57 percent of one-year stretches, 67 percent of 5-year periods and 83 percent of 20-year ranges. The Capital Group study examined 17 of the company’s mutual funds that invest in equities or both equities and bonds. It measured their performance over every one-, three-, five-, 10-, 20- and 30-year period, on a rolling monthly basis, from Dec. 31, 1933, through Dec. 31, 2012.”

Still, “only about 13% of actively managed, large-company stock funds posted returns above that of the S&P 500 for 2014,” the Wall Street Journal reports.

Although the SEC notice did not specify whether American Funds will issue active or passive ETFs, the firm’s reputation for active management implies the company would favor actively managed ETFs, a still small, but fast-growing segment of the ETF business. Some industry observers also see actively managed ETFs being a key driver of ETF industry growth in the coming years. For the week ending Jan. 16, U.S.-listed actively managed ETFs had a combined $17.24 billion in AUM with nearly half that total allocated to PIMCO and First Trust ETFs, according to AdvisorShares data.

While that is just a fraction of the overall U.S. ETF industry, increased demand for active ETFs and the potential for a more favorable regulatory environment could make actively managed ETFs a $500 billion asset class by 2020, according to a report by publishedSEI Investments last year.


Global Macro ETF: A Rareview- Look No Further and Look Down Under $MVMVE

MarketsMuse global macro trading insight courtesy of extract from 4 Feb edition of Rareview Macro LLC’s “Sight Beyond Sight” with reference to $MVE and $MVMVE

Neil Azous, Rareview Macro

There are a lot of moving parts overnight, including the continuing debate on whether crude oil has bottomed or not. But if we had to focus on just one part of the narrative it would be Australia – the tentacles of which stretch out all the way to basic resources, yield, beta, deflation, and sentiment.

Now before dismissing any read through from this antipodean nation as not as relevant as other indicators, we would argue that what is happening there may well have more meaningful ramifications for global risk assets than most realize.

Firstly, the Market Vectors Australia Junior Energy & Mining Index (symbol: MVMVE) is showing the largest positive risk-adjusted return across regions and assets for the second day in a row.

By way of background, MVMVE covers the largest and most liquid Australian and offshore small-caps generating 50%+ of their revenues from energy & mining and listed in Australia. This basket of securities is not only highly geared to capex, utilities, infrastructure, and engineering but it is the poster child for Australia-Asia commodity speculation. Put another way, it has been the worst-of-the-worst and a favorite proxy to watch for those who hold the dogmatic view that China and Australia are both zeros.

We do not want to overemphasize the importance of just one index, so we are highlighting it more as a starting point than anything else. It is not uncommon for this index to show up on our equity monitor but it is rare for it to take the leadership across all regions and assets, and very rare for that to happen on back-to-back days. For that reason, it has prompted us to do some further analysis on that food chain.

Model Portfolio Update – Increased S&P 500 (SPY) Short Position Continue reading

Russia’s ETF Tries to Get Back On The Horse

MarketMuse update courtesy of ETF Trends’ Todd Shriber.

MarketMuse has been profiling the recent market turmoil found all across Europe but mainly Greece and Russia. After a difficult past six months, Russia’s ETF has recently been back on the rise. 

Entering Tuesday, the Market Vectors Russia ETF (NYSEArca: RSX) sported a six-month loss of 35.2%, making it difficult to be bullish on Russian equities.

However, what is now a three-day rally for oil futures is compelling some traders to revisit RSX and the adventurous are even mulling positions in the Direxion Daily Russia Bull 3x Shares (NYSE: RUSL), the triple-leveraged equivalent to RSX. RSX is the oldest, largest and most heavily traded Russia listed in the U.S.

Over the past five days, the United States Brent Oil Fund (NYSEArca: BNO) is up more than 14%, which is important because Russia, the largest non-OPEC producer in the world, prices its oil in Brent terms, the global benchmark. RSX and RUSL have responded with arguably tepid five-day gains of 1.6% and 4.3%, respectively.

Still, traders with temerity might want to give RUSL a look because there are signs of capitulation among RSX bears.

“The RSX, country ETF for Russia, seen below on the daily timeframe, shows a consolidation pattern which has morphed into a sideway channel. Bears have thus far failed to crack it lower, perhaps blinded by love for a crash in crude and failing to recognize the temporary bottoming signs in place for energy and energy stocks. Thus, RUSL is on my radar as a levered long play, especially if RSX holds over $15.30 today,” according to Chessnwine of Market Chess.

Russia ETF

Lunch with Russia ETFs, in particular RUSL, is far from free. RSX has a three-year standard deviation of 27.2%. Said another way, RSX has been 1,200 basis points more volatile than the MSCI Emerging Markets Index over the past three years.

Additionally, oil prices will likely determine the near-term fate of RSX and RUSL. After all, no non-OPEC is as heavily dependent on oil as a driver of government revenue as Russia is. Nearly half of Russia’s government receipts come by way of oil exports.

Of course, there is the valuation argument, a familiar refrain of Russia bulls in recent years. Indeed, Russian stocks are down right cheap. At a forward P/E of four, the MSCI Russia Index trades at less than half valuation of the MSCI Emerging Markets Index and about a quarter of the valuation of the S&P 500.

There is another interesting point in favor of RUSL: Investors’ tendency to be wrong with leveraged ETFs. RUSL has seen outflows of over $21 million over the past month,according to Direxion data.

There is validity in going against the crowd with leveraged ETFs. Consider this: From about Aug. 20, 2014 to Sept. 23, the Direxion Daily Gold Miners Bear 3X Shares (NYSEArca: DUST) lost $185.3 million in assets but surged 55% over that period.

State Street Slashes SPDR ETF Fees; Issuers In A Race to Zero? Nah..

MarketsMuse blog update courtesy of extract from news report by Reuters’ Ashley Lau

State Street Corp said on Tuesday it has slashed management fees on 41 of its SPDR exchange-traded funds, joining major ETF providers BlackRock Inc and Vanguard in their efforts to lower fees as price competition heats up.

The price cuts at State Street, which affect a range of international and domestic equity and bond funds, come at a time when cost has become an increasingly important factor for ETF providers. Vanguard, which recently surpassed State Street to become the No. 2 U.S. ETF provider, has been winning assets with its razor-thin fees.

With the new price reductions, State Street’s SPDR Barclays Aggregate Bond ETF, for example, now has an expense ratio of 0.1 percent, down from 0.21 percent. That brings the fund closer to the range of the Vanguard Total Bond Market ETF and the iShares Core U.S. Aggregate Bond ETF, which both have an expense ratio of 0.08 percent.

State Street said the fee reductions are part of an ongoing review process “to identify improvements that are beneficial to investors.”

“Competitive pricing is a core benefit to the SPDR ETF value proposition,” said James Ross, global head of SPDR ETFs at State Street Global Advisors, the company’s asset management business.

ETF assets have been flowing into Vanguard, long a leader in low fees. It increased its U.S. market share to 21.3 percent at the end of 2014, more than doubling its market share since 2008.

BlackRock, the largest ETF provider, has also been expanding its “iShares Core” lineup of low-cost ETFs, a program it started in October 2012 to compete with cheaper funds offered by other providers. The company said on Monday it would extend a partial fee waiver of annual management fees on certain iShares funds in Canada. (Reporting by Ashley Lau; Editing by Dan Grebler)


Guggenheim Investments Eyes Currency Hedged ETFs

MarketMuse update is courtesy of Reuters

Guggenheim Investments, the seventh-largest ETF issuer in the United States, is considering trying on currency hedged ETFs for size.

Guggenheim Investments is considering launching one or more currency hedged exchange-traded funds, one of the hottest and most sought-after financial products the last few months.

“I will confirm that we’re interested in this space,” Bill Belden, Guggenheim’s managing director of product development in Chicago told Reuters on Friday. “We’re very familiar with the currency space and we’re always interested in providing new products whether they’re hedged or not.”

A currency-hedged ETF removes the foreign currency return of a given fund by buying a forward contract in the currency, and rolling it typically on a monthly basis.

Currency-hedged ETF assets grew 48 percent in 2014 to roughly $20.8 billion, and have grown 1,519 percent over the past two years, according to Deutsche Bank AG, a major player in the space.

In contrast, unhedged European equity ETFs have seen six straight months of outflows since June 2014, with an aggregate $8.9 billion in outflows, Deutsche Bank data shows. On the other hand, hedged European equity ETFs have seen consistent inflows over the same period, taking in $4.5 billion.

A strong dollar is prompting U.S. investors to buy hedged ETFs. Typically, currency-hedged ETFs protects the underlying international equity exposure against a falling foreign currency such as the euro or yen.

BlackRock Inc, WisdomTree Investments Inc and Deutsche Bank are the three major players in the currency-hedged ETF space. WisdomTree, which was the first to this ETF sector, is the largest of the three, with about 80 percent of the roughly $20 billion allocated to currency-hedged ETFs.

WisdomTree in January alone attracted $1.6 billion in inflows, according to Luciano Siracusano, WisdomTree’s chief investment strategist.

But Guggenheim’s Belden said there’s room for more players in the industry. Guggenheim has about $28.8 billion in ETF assets and roughly $220 billion overall.

“The hedged ETF you have seen basically captures an exposure to an international market that hedges against a local currency’s falling value,” said Belden.

“But we know that local currencies don’t fall perpetually. It has been a pretty consistent trend in the past but we don’t know what’s going to happen to those strategies, if any particular currency goes the other way.”

Guggenheim has a suite of nine currency ETFs, totaling about $1.1 billion. Of the nine ETFs, two have shown positive returns. CurrencyShares Japanese Yen Trust is up 1.5 percent so far this month, and the CurrencyShares Swiss Franc Trust is up 8 percent.

A Little Known ETF, Recon Capital, Comes Out Big in Its First Year

MarketMuse update courtesy of ETF Trends, Tom Lydon. Tom Lydon highlights Recon Capital ETF that follows a covered call strategy successful first year. 

A little unknown exchange traded fund that follows a covered call strategy has generated robust dividend yields over its first year.

The Recon Capital NASDAQ-100 Covered Call ETF (NasdaqGM: QYLD), which began trading on December 12, 2013, has provided a distribution yield of 10.4% in 2014, according to a press release.

QYLD provides a covered-call strategy that targets Nasdaq-100 securities. Additionally, for those who rely on regular income payments, the ETF provides monthly distributions.

The covered-call options strategy allows an investor to hold a long position in an asset while simultaneously writing, or selling, call options on the same asset. Traders would typically employ a covered-call strategy when they have a neutral view of the markets over the short-term and just bank on income generation from the option premium.

In a flat market condition, the trader would use the buy-write strategy to generate a premium on the option. If shares fall, the option expires worthless and one still keeps the premiums on the options. However, the strategy can cap the upside of a potential rally – the trader keeps the premium generated but any gains beyond the strike price will not be realized.

During last year’s rally, QYLD underperformed the broader market, rising 3.6% over the past year. Nevertheless, the ETF somewhat made up the difference through its robust income generation on option premiums.

The monthly options premiums also provided a buffer from market volatility and helped hedge traditional investment allocations. The covered-call ETF strategy may act as a decent alternative investment strategy to a traditional equity and fixed-income portfolio, especially in the environment ahead.

“Unlike many fixed income investments, QYLD faces no headwinds from rising interest rates, nor is it susceptible to duration risk,” Kevin R. Kelly, Managing Partner of Recon Capital, said in the press release. “Rather, QYLD seeks to provide investors with a low volatility, non-leveraged, tax-efficient product that pays out a monthly income, instead of making distributions by quarter or on an annual basis. We are proud to round out 2014 – and the first year of QYLD trading — with a 10.4 percent yield for our investors, particularly as the 30 Year Treasury sits below 2.75 percent.”


Virtus Investment Partners Take on The ETF Market

MarketMuse update is courtesy of MarketWatch.

Virtus Investment Partners (NASDAQ: VRTS), multi-manager asset management business,  announced that they have reached an agreement with ETF Issuer Solutions (ETFis) , a comprehensive platform for listing, operating, and distributing exchange traded funds. Virtus Investment Partners will acquire the majority interest from the deal.  The transaction will provide Virtus with manufacturing capabilities for both active and passive ETFs, adding to its broad product line-up.

ETFis, founded in 2012, recently introduced the industry’s first actively managed ETF investing exclusively in master limited partnerships, the InfraCap MLP ETF AMZA, +0.14% 1. It currently manages two other ETFs and has seven additional ETFs in registration with the Securities and Exchange Commission. All of the company’s ETFs are managed by external subadvisers.

“There is growing interest among financial advisors and investors to use exchange-traded funds in their retail and institutional portfolios because of the tax efficiency and liquidity benefits that ETFs offer,” said George R. Aylward, president and chief executive officer of Virtus. “The ETFis business model is similar to the Virtus approach of offering investors access to strategies of boutique managers. This partnership with ETFis will expand our product capabilities and allow us to offer compelling investment strategies in an actively managed ETF format.”

ETFis will become a Virtus affiliate and continue to operate as a multi-manager ETF platform, providing investors access to differentiated investment capabilities from select subadvisers. The company is led by its co-founders, Matthew B. Brown, who manages operations and technology capabilities, and William J. Smalley, head of product strategy and management.

“We developed ETF Issuer Solutions to provide a technology-driven, ETF-specific platform that offers significant cost and operational efficiencies. The partnership with Virtus gives us the resources and support to execute on our long-term vision of building a leading multi-manager ETF platform,” said Smalley. “We are excited to have the opportunity to combine our offerings with Virtus’ extensive distribution capabilities to create a compelling alternative for asset managers that want to make their actively managed strategies available in an exchange-traded fund structure.”

The Newfleet Multi-Sector Unconstrained Bond ETF2 will be the first new offering managed by a Virtus affiliate added to the ETFis platform. The fund will leverage the Newfleet Asset Management team’s broad experience in multi-sector fixed-income investing in a strategy that will have the flexibility to capitalize on opportunities across all sectors of the bond markets, including evolving, specialized, and out-of-favor sectors, as it seeks to deliver relatively high income and an attractive total return. A registration statement for the fund has been filed with the SEC.

The transaction is expected to close in March. Terms were not disclosed. Paul, Weiss, Rifkind, Wharton & Garrison LLP acted as legal advisor to Virtus. Haynes & Boone LLP acted as legal advisor to ETFis.

Forward-Looking Information

This press release contains statements that are, or may be considered to be, forward-looking statements. All statements that are not historical facts, including statements about our beliefs or expectations, are “forward-looking statements” within the meaning of The Private Securities Litigation Reform Act of 1995. These statements may be identified by such forward-looking terminology as “expect,” “estimate,” “plan,” “intend,” “believe,” “anticipate,” “may,” “will,” “should,” “could,” “continue,” “project,” or similar statements or variations of such terms. Our forward-looking statements are based on a series of expectations, assumptions and projections about our company, are not guarantees of future results or performance, and involve substantial risks and uncertainty as described in our most recent Annual Report on Form 10-K or in any of our filings with the Securities and Exchange Commission (“SEC”), which are available on our website at www.virtus.com under “Investor Relations.” All of our forward-looking statements are as of the date of this release only. The company can give no assurance that such expectations or forward-looking statements will prove to be correct. Actual results may differ materially. You are urged to carefully consider all such factors.

For the entire article from MarketWatch, click here.