All posts by MarketsMuse Staff Reporter

Breaking News: The Black Swan from Switzerland: A Macro View and the ETF Angle

Marketsmuse.com update profiling Swiss National Bank (SNB) lowering of deposit rate to a -0.75% has, as noted by Neil Azous of global macro think Rareview Macro LLC,  “shocked the markets” and “will be booked into the Black Swan record books as an event to be remembered. ” Below update starts with extract from late morning edition of Rareview Macro’s “Sight Beyond Sight” and followed by the ETF angle, courtesy of late morning summary from ETFtrends.com

Neil Azous, Rareview Macro

Historic Day for Global Investors…Impact Will Be Felt for Weeks to Come

  • Model Portfolio – Update
    Can You Trade Swiss Franc?
    Commodities – Quick Thoughts
    Big Picture – Asset Allocation


This morning, in a move that shocked the markets, the Swiss National Bank (SNB) removed its minimum exchange rate policy of holding the Euro-Swiss (EUR/CHF) at 1.20, lowered its deposit rate to -0.75% from -0.30%, and their target LIBOR rate to between -1.25% and -0.25%. The main reason offered by the SNB for its decision was the strength of the US Dollar and the diverging monetary policy between regions.

As a reminder, the SNB had a regularly scheduled meeting on December 11th where no changes to policy were made, just a reiteration that it remained steadfast in its commitment to the EUR/CHF 1.20 floor. On December 18th, largely as a result of very strong safe-haven inflow from Russia, the SNB surprised the market and reduced its deposit rate to -0.30% from -0.05%, surpassing the European Central Bank’s (ECB) which set its deposit rate at -0.25%. Two days ago the SNB’s vice-chairman said that the bank “are convinced that the minimum exchange rate must remain the cornerstone of our monetary policy”. In other words, there was no warning of this.

Since the EUR/CHF 1.20 floor was introduced a few years back the market sentiment was firm in that if the floor was to ever break then the initial downside risk was 1.15-1.10 at a maximum.

The Electronic Broking Services (EBS), the benchmark for professional FX trading, said the market low for the EUR/CHF on its platform was 0.8500 Francs per Euro and confirmed the “miss-hit” at 0.0015.

THAT MEANS NO ONE GOT STOPPED OUT OF THEIR LONG EUR/CHF POSITION ABOVE 1.0000!

This is not the commodities market, where traders place stop-limit orders and wait for a product to bounce back before being taken out of their position due to illiquidity. It is FX where stop-loss orders are predominantly used and you are taken out at the level at which the market first traded.

Therefore, today will go down in history as a “Black Swan” event. Continue reading

Upcoming Elections in Greece Make ETF Markets Volatile

MarketMuse update courtesy of Todd Shriber from ETF Trends.

The Global X FTSE Greece 20 ETF (NYSEArca: GREK) is off 3% to start 2015 and with anxiety running high that Greece is still a candidate for departure from the Eurozone, global equity market volatility and investors’ skittishness is on the rise.

With Greek elections slated for Jan. 25, global investors are understandably nervous about what the Eurozone will look like in the future. While Moody’s believes Greece’s Eurozone departure probability is not as high today as it was in 2012, there are still negative implications with such an event for fellow Eurozone nations.

Investors can mitigate Greek volatility with a familiar source: U.S.-focused low volatility ETFs, which outperformed traditional benchmarks in 2014. That group includes thePowerShares S&P 500 Low Volatility Portfolio (NYSEArca: SPLV).

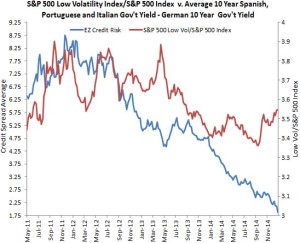
“The relative performance of the S&P 500 Low Volatility Index during the Greek crisis in 2011 and 2012 offers insight into risk mitigation,” according to a recent note by PowerShares.

A favored measuring stick for gauging Eurozone volatility is 10-year government bond yields, but combining that with how SPLV’s underlying index performed against the S&P 500 during periods of elevated Eurozone stress proves instructive for investors.

In the chart below, “the red line shows the performance of the S&P 500 Low Volatility Index relative to the S&P 500 Index, based on weekly closing data. When we compare the red line with the blue line, we see that the S&P 500 Low Volatility Index outperformed the S&P 500 Index during each wave of credit stress in the Eurozone,” notes PowerShares.548x445xsplv.png.pagespeed.ic.RdYuDOmWxM


For original article from ETF Trends, click here.

Issuers Get Pickier Over Which ETFs to Launch

MarketMuse update courtesy of ETF Trends’ Tom Lydon.  

In 2014, just over 200 new exchange traded products launched in the U.S., more than double the nearly 90 that closed, but even with launches continuing to easily outpace closures, some major ETF issuers are getting choosy about the new number of rookie products they bring to market.

For example, BlackRock (NYSE: BLK), the parent company of iShares, the world’s largest ETF sponsor, launched 29 new ETFs in 2014, a number that matches the ETFs shuttered by the firm, reports Victor Reklaitis for MarketWatch.

The bulk of iShares’ closures came by way of an August announcement declaring 18 closures. Ten of those 18 ETFs, all of which ceased trading in mid-October, were target date funds. In early 2014, iShares announced the closure of 10 ex-U.S. sector ETFs.

Some of the more successful ETFs launched by iShares last year include the $146.1 million iShares Core Dividend Growth ETF (NYSEArca: DGRO), the $206.2 millioniShares Core MSCI Europe ETF (NYSEArca: IEUR) and the $140.3 million iShares MSCI ACWI Low Carbon Target ETF (NYSEArca: CRBN).

Increased selectivity by issuers when it comes bring new ETFs could become a more prominent theme as the battle for investors’ assets intensifies. Simply put, many new ETFs struggle out of the gates and go months if not years with nary a glance from advisors and investors. As of late December, 92 of the ETFs launched last year had over $10 million in assets under management and none of 2014’s crop of new ETFs came within spitting distance of the over $1 billion accumulated by the First Trust Dorsey Wright Focus 5 ETF (NasdaqGM: FV). FV debuted last March and by November had over $1 billion in assets

There are more than 7,500 U.S. open-end mutual funds, MarketWatch reports, citing Morningstar data, implying there is room for the U.S. ETF industry to grow from the current area of about 1,700 products.

One thing is clear: Different issuers are taking different approaches to new ETFs. For example, Vanguard, the third-largest U.S. ETF issuer, did not bring a new ETF to market in 2014 but still managed to add $75.3 billion in new ETF assets, a total surpassed only by iShares. Earlier this month, Pennsylvania-based Vanguard said it expects to launch its first municipal bond ETF early in the second quarter.

First Trust, one of the fastest-growing U.S. ETF sponsors, launched 15 new products last year, including FV.

For the original article from ETF Trends, click here.


New Equity ETF Hopes to Combat Volatility

MarketMuse update courtesy of Nasdaq’s Len Zacks.

2015 has started out week for the US equity market but Direxion has a plan to change that.

After delivering handsome returns last year, the U.S. equity markets have started the year on a weak note.  Slumping crude oil prices, strong dollar and global growth concerns with Europe fighting deflation, Japan still struggling in a recession and China losing steam, are weighing upon the market sentiment, leading to increased market volatility.

As a result, low volatility funds are gaining immense popularity as they provide improved risk adjusted returns in a choppy market. Given the trend, Direxion has recently filed for a product focusing on this niche segment

Below, we have highlighted some of the details of the newly filed product.

Direxion Value Line Conservative Equity ETF

As per the SEC filing, the fund seeks to track the Value Line Conservative Equity Index. The index consists of roughly 170 U.S. stocks that have been selected using Value Line’s proprietary Safety Ranking. The ranking methodology measures the total risk of a stock and its capability to withstand an overall equity market downturn relative to the other stocks in the Value Line universe which consists of roughly 4,000 stocks.

The total risk or volatility of each stock is measured through its Price Stability Score and Financial Strength rating. The Price Stability score for a stock is based on a ranking of the standard deviation of weekly percentage changes in the price of the stock over the past five years.

For the Financial Strength rating, a number of balance sheet and income statement factors like the company’s long-term debt to total capital ratio, short-term debt and amount of cash on hand are reviewed to assign a ranking.

Sector-wise, consumer staples and health care form a large part of the index.

How Does it Fit in a Portfolio?

The product could be an interesting choice for investors seeking to avoid market volatility but remain invested in stocks.  Low volatility products have proven beneficial for investors given their superior risk adjusted returns.

These funds have gained immense popularity in the past few months given increased market volatility on the back of global growth concerns, slumping crude prices and worries related to the timing of interest rate hike in the U.S.

For the complete article on Nasdaq’s site, click here.


Shanghai Stock Exchange to Launch Options Trading on SSE 50 ETF

MarketsMuse update courtesy of AsiaAsset News

asia asset mgt logoThe Shanghai Stock Exchange (SSE) will unveil its first ETF option next month as a testing ground for the pilot stock option trading program in China.

The China Securities Regulatory Commission (CSRC) said it has authorized the SSE to launch the pilot program with an option based on the SSE 50 Index ETF as the debut product. It will land on the bourse on February 9. The index in question tracks the 50 largest and most representative stocks listed in Shanghai.

The Mainland’s securities watchdog said in a statement that stock options comprise of options based on individual equities and ETFs linked to share indices. “Individual stock options and ETF options are important types of options in international capital markets. They have a role to play in risk management which cannot be replaced by other financial vehicles,” the CSRC said. It added that turnover in options has reached a level similar to that in futures in recent years in terms of trade conducted on global exchanges, signaling a large demand for these products. Continue reading

NASDAQ Challenges the NYSE to Run Dark Pools

MarketMuse update courtesy of Reuters in CNBC

The NYSE has recently come close to completing a deal with some big banks to take over running the banks’ dark pools. Now, NASDAQ is proposing an alternative solution as they eye running dark pools for banks as well.

Nasdaq OMX Group has approached several big banks with a proposal to take over the operation of their so-called “dark pools,” and plans to seek regulatory permission to do so, The Wall Street Journal reported, citing Nasdaq Chief Executive Robert Greifeld.

The new initiative was a response to the needs of the company’s customers and not a strategic change, the Journal quoted Greifeld as saying.

Exchanges have been losing market share to broker-run alternative trading systems, including “dark pools,” partly as brokers seek to avoid high exchange fees.

Dark pools are broker-run electronic trading venues, and several big banks have one. They allow investors to trade anonymously and only make trading data available after a trade, reducing the chance that others in the market will know about the buyer’s or seller’s intentions and move the price against them.

Dark pool venues have come under scrutiny amid concerns their unlit markets may drive too much volume away from traditional exchanges and make it hard for investors to see demand and potentially distorting prices.

Last month, Citigroup said it would shut down its alternative stock trading venue LavaFlow, at a time when regulatory scrutiny has increased around broker-run trading platforms, forcing banks to rethink the costs. Wells Fargo shut its dark pool in October, citing a lack of customer demand.

Banks’ “costs are skyrocketing and our job is figuring out how we can help them solve that problem,” Greifeld told the Journal.

Using its technology, surveillance software and regulatory expertise, Nasdaq can manage dark pools on behalf of banks, still allowing them to trade at lower prices than they do on exchanges and letting bank customers trade anonymously, the newspaper reported.

A final business product hasn’t been completed and plans may change, the Journal said.

Representatives at the Nasdaq were not immediately available for comment outside regular U.S. business hours.

The U.S. Securities and Exchange Commission Chair Mary Jo White announced last year that she planned to propose new rules that would require alternative trading platform operators to disclose more details to the public about the way they operate.

For the original article, click here.

CDS Market Says: “How Crude” 1:3 Chance of Russian Default; Mining For Gold ETFs in Them Thar Hills

Below extract courtesy of global macro trading think tank Rareview Macro LLC ‘s  Jan 13 edition of daily commentary via “Sight Beyond Sight”

Neil Azous, Rareview Macro

To Russia Without Much Love: Crude Catalyst and Credit Impact

With another day of lower Crude Oil prices, the vice-grip on the Russian Federation continues to be tightened.

The 5-year credit default swap (CDS) spread has widened out to a new high today and the default probability has increased too slightly above ~34%. In November, there was just a 1 in 5 chance of default. In December, there was just a 1 in 4 chance of default. In January, there is now a 1 in 3 chance of default. The Rubble Basket (symbol: RUBBASK) is above 70.00. It has only traded with a “70 handle” during the height of the December 15-18th currency crisis.

With interest rates above 17% and a continuing effort to defend the Rubble exchange rate, the Russian credit market remains the release valve for stress. This should not be a surprise given that Fitch joined S&P last week in lowering its credit rating to BBB-, the lowest level before junk.

As a reminder, at the end of December, S&P put the country on credit watch negative and has 90-days to act. However, in its press release on December 30th the ratings agency said that it aims to resolve its corporate debt ratings by the end of January, after it makes a decision on the sovereign grade. Given the continued breakdown in the Crude Oil price, speculators are increasingly sensitive to the fact that S&P could very soon be the first rating agency to lower Russia to high yield.

Gold Miners:  Quick Update: GDX & GFI Could Gain Continue reading

Egypt to Allow ETF Trading for the First Time

MarketMuse update courtesy of Reuters.

Egypt prepares for the first ETF to be traded on their stock exchange for the first time ever on Wednesday, January 14. They hope that this will help gain more foreign investors and boost cash flow. 

Egypt’s stock exchange will allow trading in Exchange Traded Funds (ETFs) for the first time on Wednesday, as part of efforts to encourage foreign investment and boost liquidity.

ETFs are typically funds that track equity indexes, though they can also track commodities and other assets, with component stocks usually represented in proportion to the size of their market capitalization.

ETFs are traded like a stock and can allow investors to diversify their risks and reduce transaction costs.

The introduction of ETFs in Egypt comes amid a flurry of takeovers and share issues on Egypt’s stock exchange, signalling resurgent interest from international investors in a market looking to restore confidence after the turmoil unleashed by a 2011 uprising which ousted leader Hosni Mubarak.

The main stock index rose about 30 percent in 2014 and trading volumes have rebounded above levels seen in 2010.

“We are working on offering new investment vehicles to investors and in the long run, these funds will help to create liquidity in the market,” Mohamed Omran, chairman of the Egyptian Exchange, told Reuters.

“The funds will help investors reduce risk by investing in the market as a whole.”

The introduction of ETFs will also allow for the emergence of market-makers in Egypt for the first time, potentially boosting liquidity.

Egypt’s Beltone Financial Holding, which specialises in brokerage, investment banking and private equity, won Egypt’s first licence to operate an ETF on the Egyptian Exchange in April.

Its ETF is being launched with an initial value of 10 million Egyptian pounds ($1.4 million), according to Alia Jumaa, head of investment for the new fund.

For the original article from Reuters, click here

Steven Wallman’s Holistic Approach to Trading

MarketMuse update courtesy of ETF.com’s Cinthia Murphy

Steven Wallman was a commissioner with the SEC in the mid-1990s. An authority on securities markets and trading, today he leads an ETF-centered online brokerage, Folio Investing. Wallman is also keen on seeing the SEC start using a thoughtful “holistic” method to evaluate the worthiness of new ETFs as opposed to a more case-by-case approach.

That could have far-reaching effects on the availability of innovative nontransparent actively managed wrappers, Wallman told ETF.com in a recent interview. He held up Eaton Vance and Precidian’s different experiences at SEC in the past few years as each pursues distinct nontransparent active ETFs as examples of a need for a new approach.

ETF.com: Both Eaton Vance and Precidian are looking to launch nontransparent exchange-traded products. They are different structures, but why do you think the SEC approved one and not the other? Is it all centered on their tradability?

Steven Wallman: The Eaton Vance one that has been approved, from what I’ve read, allows people to sort of bid off of the indicated NAV that will be changing on a 15-minute basis during the day. And then you would be bidding a basis point up or down off of that, depending on what you think the market and the securities are doing.

It does have an intraday element to it. Precidian’s was designed more as sort of the equivalent of a nontransparent but actively managed ETF that would allow for intraday trading. But the question is, allow it for what, on what basis? How do you make a decision?

What is the SEC is trying to protect against? What is it that it’s trying to permit? And what actually makes the most sense for it to be able to do? The lack of a holistic, clear outline with a proposal for how they would be addressing this is what seems to me to be missing. And in part, that’s why it’s taken so many years for this to develop and for ETFs, on the active side, to come to market.

It’s a little bit strange how the commission has addressed some of this. Its approach to these new products has been sort of piecemeal without the benefit of an overall theory guiding it.

ETF.com: Has this lack of a consistent approach been a big barrier to entry for active ETFs?

Wallman: It’s clearly been a significant barrier for active ETFs at the moment, and that is evidenced by the fact that there are several that have been attempted for many years and there still are very few of them.

With passive vehicles, that has been run to the ground a little bit more easily. By now, we have a more certain template and model for what would work at this point than for active.

On the other hand, remember that it took passive years to be able to come to market as well. At the beginning, there was no good mechanism that allowed it to slot in. You just had a framework that basically said, “Unless you fit into this one very particular kind of framework, nothing else is permitted unless the SEC provides a waiver.”

We’re in this sort of one-by-one-by-one analysis for all of these, and I think now—and it probably should have done so quite a while ago—the SEC ought to shift to a much more holistic view of what is the whole issue here and how do we resolve it, as opposed to, “This one looks OK; that one doesn’t look OK,” even if it’s hard for people to tell the difference.

ETF.com: Are these nontransparent structures more focused on issuer survival than on investor well-being, and maybe that is what the SEC is concerned about here? Are they just a result of mutual fund companies trying to find a spot in the ETF world?

Wallman: I don’t think so. A lot of the ETF providers at this point are mutual fund companies. Vanguard, for example, has a huge array of ETFs, and they’re certainly a well-known mutual fund company. You also have a number of providers of ETFs that are not mutual fund companies.

The proliferation of ETFs and the rise of them as a good vehicle for certain cohorts of investors to utilize is a good thing for the market. It is a new innovation—or it was a new innovation 25 years ago. It’s an increasingly used innovation.

The fact that there are providers of mutual funds who also want to come up with new vehicles is a good thing. So I don’t think any of this is about survival of the mutual fund industry.

For the complete interview from ETF.com, click here.

Dark Trading Pools: Deconstructing Market Structure?

MarketMuse update courtesy of Anna Bernasek 9 January article in The New York Times.

JUDGING solely by the name, stock trading in so-called dark pools may conjure up images of mysterious deals cut beyond public view. Also called simply “dark trading,” it happens when computers serve as matchmakers and bid-and-ask quotations aren’t displayed to all participants. What’s surprising is just how big the dark-trading market has become.

trading in dark 1In the third quarter of 2014, the average daily volume of dark shares was 2.56 billion, accounting for 45 percent of the total average daily share volume in the United States, according to a report from the TABB Group, a financial research and advisory firm. That is up from 42 percent during the same period in 2013, according to the report.

What’s behind the growth? “The proliferation of dark volume is partly because of technological advancement and the creation of multiple trading venues,” said Sayena Mostowfi, senior analyst for equities at the TABB Group and author of the report. “The thinking is if you have the match internally, why would you go to the exchange?”

Assessing the overall impact of dark trading isn’t simple. Connecting computers with other computers might simply seem to be the height of efficiency, and no doubt it has some advantages. But while dark trading can benefit some insiders, it may cost the market as a whole.

For one thing, dark trading has led to greater fragmentation of the domestic stock market, which is now made up of around 300 venues. Only 13 of these are registered exchanges, while the rest are alternative trading systems or broker-dealer platforms, according to a recent paper by Frank Hatheway, chief economist for Nasdaq; Amy Kwan, now a lecturer in finance at the University of Sydney Business School in Australia; and Hui Zheng, a senior lecturer at the same school. This fragmentation has made it more difficult for many traders to find the best prices.

The paper concluded that, on balance, dark trading turns out to raise aggregate transaction costs and reduce the accuracy of prices displayed in traditional trading venues. The paper’s findings would seem to suggest that the more dark trading grows, the less meaningful public stock quotes are. And that possibility is something that all investors should be concerned about.

For the original article from The New York Times, click here


Philippines Has Rising Star in the ETFs Market

MarketMuse update courtesy of ETF Trends’ Todd Shriber.

After finishing lower for a second consecutive year in 2014, diversified emerging markets exchange traded funds are off to decent though not spectacular starts in 2015.

Off to a more impressive start than broader peers, such as the iShares MSCI Emerging Markets ETF (NYSEArca: EEM) and the Vanguard FTSE Emerging Markets ETF (NYSEArca: VWO), is the iShares MSCI Philippines ETF (NYSEArca: EPHE). EPHE, the lone Philippines ETF, entered Friday with a 2015 gain of 2.6%, or nearly quadruple that of VWO.

In 2014, EPHE gained more than 22% while EEM and VWO each finished the year in the red. EPHE now resides less than 10% below its all-time high set in January 2013 and more gains could be on the way after stocks in Manila rose to a record during Friday’s Asian session.

Like India, the Philippines is getting a significant economic boost from lower oil prices because the Philippines is dependent on oil imports to help power one of Southeast Asia’s fastest-growing economies. Over the past six months, the U.S. Oil Fund (NYSEArca: USO) has plunged 51%, but the WisdomTree India Earnings Fund (NYSEArca: EPI) and EPHE have traded modestly higher over that period.

Investors are paying up to be involved with Philippine equities.

“Shares in the Philippine Stock Exchange Index are valued at 18.4 times 12-month estimated earnings, the highest since Nov. 26. The gauge has the highest multiple among Asia’s benchmark equity indexes,” reports Michael Patterson for Bloomberg.

The MSCI Emerging Markets Index trades at about 11 times earnings, but that did not prevent EPHE from hauling in $44.3 million in new assets last year. That is nearly 12% of the ETF’s current assets under management, indicating U.S. investors remain underweight Philippine equities. That may not be the case for long.

“The Taiwanese, Philippine and South Korean stock markets also warrant over-emphases on account of their stable political regimes, reliable policymaking climates and healthy economic prognoses,” said S&P Capital IQ.

For 2015, Morgan Stanley “said the Philippines was the best-positioned market due to its ample liquidity, strong forecast gross domestic product growth and low levels of credit penetration,” reports The Star.

A stronger U.S. dollar is helping Philippine stocks beyond lower oil prices. Foreign remittances are now worth more when converted into pesos, helping boost the local economy. EPHE allocates nearly 12% of its weight to consumer sectors.

In fact, the Philippines has already issued dollar-denominated bonds this year, becoming the first emerging market to do so. The Philippines can afford to do that because its external funding costs are low relative to other developing economies and the country has an investment-grade rating from all three major ratings agencies.

For the original article by Todd Shriber from ETF Trends, click here.

Turm- Oil: Black Gold Turns to More than 50 Shades of Gray for High Yield Bond ETFs

MarketsMuse update on the downtick in oil prices and impact on high yield bond ETFs, including energy-sectory junk bonds includes extract from Institutional Investor Jan 7 coverage by Andrew Barber.

MarketsMuse editor note: The recent implosion of crude oil prices has triggered a conundrum for almost every investment analyst who prides themself on pontificating the domino effect impact on the broad universe of market sectors and asset classes. Much has been said about the how, when and where the trickle-down effect of the lower oil prices will effect corporate balance sheets, and in particular, those with a boatload of outstanding debt.  For high-grade corporate debt issuers, some believe lower energy costs bode will. For high yield bond issuers (companies that typically include energy industry players), the jury remains out for the most part. Experts that MarketsMuse has spoken with believe that if US drillers and frakers cut back on operations and reduce overhead quickly, it will help stem the burn that inevitably results from manufacturing a product that costs almost as much (if not more) to make as it what customers pay for it. Then again, as the supply begins to wane consequent to production cutbacks, market forces will, in theory, cause prices to rise..and those companies will be back in the black before having to sweat too much about interest payments on outstanding debt.

II logo


II’s coverage on the topic is framed nicely via this extract:

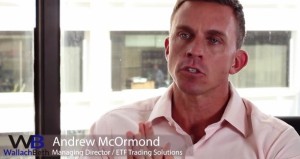
mcormond jan15 The impact of rising yield for energy producers on high yield markets has also spilled over into the exchange-traded funds and closed-end funds. “ETFs create a simple wrapper for investors to modify easily their exposure to high yield fixed income markets” says Andy McOrmond, managing director at WallachBeth Capital, a New York-based institutional brokerage that focuses on ETF and portfolio trading. Mohit Bajaj, director of ETF trading solutions, also at WallachBeth, notes that despite the volatility injected into the market for high-yield exchanged-traded products during the recent oil sell-off, short interest has remained relatively stable and borrows have been easily obtainable. Bajaj attritubes this stability to a maturing institutional appreciation of exchange-traded fund products.


For the full article from II, please click here


Euro Exposure? Eurozone Bond ETFs In Advance of ECB’s QE

MarketsMuse.com update courtesy of extract from Jan 6 ETF.com article by Dennis Hudacheck, with a look at Eurobond ETFs $HEDJ,$DBEU, $HEZU, $EZU, $DBEZ, $VGK, $FEZ, $DFE

All eyes are on the European Central Bank’s Jan. 22, 2015 meeting, as it’s no secret that ECB President Mario Draghi has been hinting at a large-scale quantitative easing program for some time.

There’s no guarantee the ECB will actually implement any such program in January, but the consensus seems to be that there will be some type of big announcement on that front sometime in the first quarter of 2015.

At the same time, the U.S. Federal Reserve is expected to begin raising rates in mid-2015. This opposing force between the world’s two largest central banks has strategists calling for a currency-hedged strategy to capitalize on a rising-equity/falling-euro scenario in Europe.

An Equity ETF Designed For A Weakening Euro For currency-hedged options, the $5.6 billion WisdomTree Europe Hedged Equity Fund (HEDJ | B-47) is by far the leading ETF in the space.

Despite its “Europe” name, HEDJ focuses exclusively on eurozone securities. That means that for better or worse, it excludes the U.K., Switzerland and Sweden, which account for roughly 50 percent of Europe’s equity market capitalization, combined.

More importantly, it carries a significant exporter bias, attempting to capitalize on a weakening-euro scenario. The dividend-weighted ETF does this by screening out any company that gets more than 50 percent of its revenues from within Europe.

This makes HEDJ geared toward investors with a strong bearish view on the euro. Naturally, the fund favors consumer sectors over financials compared with vanilla, cap-weighted European indexes (MSCI Europe IMI Index).

This now-blockbuster fund tracks its index well and trades more than $80 million a day at 3 basis point spreads, keeping overall trading costs very low.

‘Neutral’ Currency-Hedged Products Contrary to popular thinking, investors interested in currency-hedged Europe ETFs don’t necessarily have to be bearish on the euro. They might have a neutral view, and simply prefer a purer equity exposure by taking any currency fluctuations out of the equation.The Deutsche X-trackers MSCI Europe Hedged Equity ETF (DBEU | B-66) is also a leading ETF in the space, and takes a broader approach, including all of developed Europe, beyond the eurozone.

It tracks a cap-weighted index and neutralizes exposure to the euro, the British pound, the Swiss franc and a few other European currencies against the dollar. DBEU has more than $710 million in assets and trades with robust liquidity that’s sufficient for small and large investors alike.

For a neutral currency take on the eurozone, rising in popularity is the iShares Currency Hedged MSCI EMU ETF (HEZU), which literally holds the $7.5 billion iShares MSCI EMU ETF (EZU | A-63) with a forward contract overlay to neutralize euro exposure.

For the entire analysis from ETF.com, please click here

Backdoor Way to Hedge Crude Oil Bounce; Exiting China: A Very Rareview

Below fast market update courtesy of Rareview Macro LLC a.m. edition of global macro strategy commentary “Sight Beyond Sight”; MarketsMuse is re-publishing this extract no more than 10 minutes of current subscribers receipt..Our thanks to the folks at Rareview!
• New Position: Long Canadian Dollar versus Short Swiss Franc (CAD/CHF)
• Existing Position: iShares China Large-Cap ETF (FXI) Now Above Strike Price

Something very illuminating appeared on our risk-adjusted return monitor today.

Neil Azous, Rareview Macro

After reading the tea leaves, the conclusion we have drawn from it points to a trend that will have meaningful global repercussions – and will also provide the basis for an investment and hedging opportunity.

Additionally, while everyone else is focused on the weakness in the Euro exchange rate (i.e. the ECB EUR/USD fix on January 4, 1999 was 1.1789 vs. last price 1.1782 ECB Statistical Data Warehouse), or else trying to figure out whether the S&P 500 is half-way through a V-shaped recovery and the bounce is actually tradable, this is genuinely a “Rareview” – one that has not been widely observed in the market yet.

See the below illustration. In yesterday’s edition of Sight Beyond Sight, we highlighted that the release of the latest data on Switzerland’s Foreign Currency Reserves showed thelargest rise since mid-2012 when ECB President Mario Draghi famously said “we will do whatever it takes” to save the euro. Specifically, FX reserves were 495.1 bln vs. 472.0 bln estimated vs. 462.7 bln previously. Put another way, they ended up rising by 32.4 bln versus the expected 9.3 bln. A forecast missing by 23.1 bln is, to put it mildly, a significant event and one that highlights the degree of flight to quality away from Russia in mid-December.

Continue reading
Vanguard Files For The Company’s First Muni Bond ETF

MarketMuse update courtesy of ETF Trends’ Tom Lydon’s 6 January story.

Vanguard, the third-largest U.S. issuer of exchange traded funds, has filed plans with the Securities and Exchange Commission to introduce the firm’s municipal bond ETF.

The Vanguard Tax-Exempt Bond Index Fund will be the firm’s first tax-exempt index fund and ETF. Pennsylvania-based Vanguard already has a substantial municipal bond footprint with about $140 billion in tax-exempt bond and money market funds, according to a statement issued by the firm.

Vanguard offers 12 actively managed municipal bond funds (five national, seven state-specific) and six tax-exempt money market funds (one national, five state-specific), according to the statement.

The Vanguard Tax-Exempt Bond Index Fund is expected to debut in the second quarter with three share classes – Investor Shares, Admiral Shares and ETF. The new ETF will have an annual expense ratio of 0.12%, well below the average annual fee of 0.49% on municipal bond ETFs, said Vanguard, citing Lipper data.

The statement did not include a ticker for the new ETF.

“For investors in high tax brackets, a high-quality, broadly diversified municipal bond fund or ETF can provide tax advantages as well as diversification from the risks of the equity market,” said Vanguard CEO Bill McNabb in the statement. “Vanguard is pleased to bring a low-cost index option to the municipal category as a complement to our lineup of low-cost actively managed tax-exempt bond funds.”

That jibes with Vanguard’s reputation for being one of the low-cost leaders in the ETF space. In December, Vanguard lowered fees on 12 of its equity-based ETFs, including 10 sector funds, moving the issuer into a tie with Fidelity for the least expensive sector ETFs.

Vanguard currently sponsors 13 fixed income ETFs, including the behemoth VanguardTotal Bond Market ETF (NYSEArca: BND). Home to nearly $24 billion in assets under management, BND was one of 2014’s top asset-gathering ETFs. Other Vanguard bond ETFs include the Vanguard Extended Duration Treasury ETF (NYSEArca: EDV) and the Vanguard Total International Bond ETF (NYSEArca: BNDX), two last year’s top performing bond funds.

Last year, investors poured a record $215.5 billion into Vanguard funds, including $75.3 billion into Vanguard ETFs. Including BND, four Vanguard ETFs were among the top 10 asset-gathering ETFs in 2014.

For the original story in ETF Trends, click here.


WisdomTree Case Study: ETF Best Execution

MarketsMuse editor note: The following post, extracted from Jan 6 submission to ETFtrends.com is best described as an advertorial courtesy of WisdomTree Investments, one of the ETF industry’s leading Issuers. While readers of MarketsMuse might be inclined to muse “[This ‘case study’ is] Elementary, my dear Watson, totally elementary!,” MarketsMuse editors would retort: “You would be astounded by the number of ‘sophisticated’ investment managers who somehow still don’t understand how block trades in ETFs are best executed, and precisely who these managers should be seeking objective guidance from before hitting a “send” button.

Equally important: the below submission makes frequent reference to ETF “market-makers”, a phrase that traditionally infers “proprietary trader who is taking the other side of a customer’s trade in order to extract a trading profit.” In today’s market structure, those who ‘make’ markets also include agency-only brokers, who, unlike traditional “market-makers”, agency brokers perform a similar role within the context of providing best available 2-sided quotes; they act as fiduciaries and specialize in sourcing liquidity from among an assortment of “market-makers. Instead of trading against customers, these brokers act in the interest of customers and simply charge a pre-disclosed commission for sourcing liquidity and executing  the right price. As such, these agency-only experts act in the interests of the customer and [arguably] are the best route for fiduciaries who seek best price based on an aggregation of all available bids and offers that are typically not displayed on ubiquitous, screen-based markets.

Here is the extract of WisdomTree’s submission:

wisdom treeThis blog post is relevant to institutional investors interested in trading exchange-traded funds (ETFs) in significant volume. Individual investors do not always have access to liquidity providers to trade ETFs as referenced below.

What if I told you that a large $500 million order and a smaller $1.2 million order traded in the same ETF, but one executed around the bid/ask spread and the other drove up the ETF price 84 cents, or almost 5%. Could you guess which trade was responsible for each outcome? The answer may surprise you. The $500 million notional block traded in-line, and a small order of $1.2 million notional block pushed the WisdomTree Brazilian Real Fund (BZF) price 5% away from its underlying value. The trades were done on different days and times, but the price of the ETF and its trading characteristics were similar. So what was the difference between the two trades?

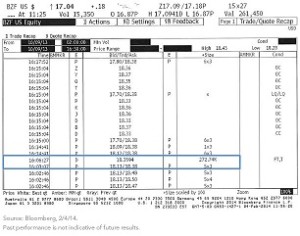
On October 9, 2013, a 27-million-share block order worth approximately $500 million executed inside the bid/ask spread of BZF. You can see the trade in the highlighted area in figure 1.

Wisdom Image 1

The client who initiated that trade was able to work with an ETF liquidity provider who had the ability to access the underlying basket in the primary market on behalf of the client. It is important to remember that an ETF is at least as liquid as its underlying securities, regardless of the average daily volume. That demonstrates the beauty of the open-ended ETF structure and its ability to create new shares and redeem shares daily. This trade was successful from an execution standpoint because the client worked together with their trading partners on a best execution strategy.

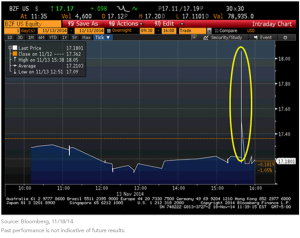
On the other side of the execution spectrum, another investor entered a 70,000-share ($1.2 million notional value) market order in BZF on November 13, 2014, just before 3:39 p.m. ET. This resulted in a quick spike up in the price of the ETF, as you can see in figure 2.

Wisdom Image 2

In this second example, the order book, or depth of the bids and offers of the ETF trading on the exchange, handled a market order of this size in an inefficient manner. The depth of bids and offers in an ETF order book is not always reflective of the liquidity of the underlying asset. While there is a lot of liquidity in Brazilian Real forwards, there are not a lot of resting orders in the BZF order book. By definition, a “market order” is designed to buy or sell an investment immediately at the best available price on the secondary market and will not stop until completed. For this reason, the order for 70,000 shares swept up all available shares for sale until it was completed, which resulted in the price increasing by almost 5%. This was followed by the price of the ETF correcting back in line with the “indicative value” of the underlying basket. Figure 3, and the yellow arrow, illustrate how quickly the order was filled and how far the price moved to satisfy the 70,000- share buy order in the order book.

You may be wondering, “Isn’t there a market maker who is supposed to be providing liquidity so this doesn’t happen?” The answer is yes. [MarketsMuse editor note: But unlike the days of yore, when stock exchange floor specialists were required to ‘take the other side’ of investor orders within the context of prevailing volume, the ‘new market structure’ does not mean that a market maker must provide any more than that he or she would be willing to buy or sell on either side of the prevailing quote. And, because the “beauty” of today’s electronic markets is that bid-offer spreads can move more quickly than you can blink your eye, a market order typically moves so fast that it may not provide enough time for the market maker to “reload” their bid or offer on the screen before the order has driven up the price significantly.]

In summary, these two examples are something that all ETF investors can learn from. On the Capital Markets Team at WisdomTree, we try to be proactive in consulting with our clients on best- execution strategies. For larger orders, always look to work with a liquidity provider who can access the underlying basket on the clients’ behalf and provide execution close to the “fair value” of the ETF. Lastly, we encourage all investors to be sure to have a full grasp of the depth of the order book before implementing any market order. We hope this information helps investors in future ETF.

For the full article at ETFtrends.com, please click here

Finally! Now You Know How to Play the Oil ETFs

MarketMuse update courtesy of ValueWalk.

It’s the first (real) week back from holiday break, but the story is the same as it was before Christmas, and before Thanksgiving for that matter…. Crude Oil continues to fall like a lead oil filled balloon, falling below the $50 mark on Monday for the first time since 2009. It’s even gotten to the point of family and friends asking where we think Crude Oil will bottom at parties and dinners, getting our contrarian antennas perked up.

The million, or actually Trillion, dollar question is where will Crude finally find a bottom and bounce back? Fortune let us know recently that the $55 drop in Brent Oil prices represents about a Trillion dollars in annual savings.

Now, while some are no doubt betting on continued downside with the recent belles of the ball – the inverse oil ETFs and ETNs ($DTO) ($SCO) ($DWTI), the last of which is up a smooth 527% since July {past performance is not necessarily indicative of future results}. Others are no doubt positioning for the inevitable rebound in energy prices, thinking it is just a matter of when, not if. Crude Oil is back around $70 to $100 a barrel. And what a trade that would be. Consider a move back to just $75 a barrel, the very low end of where Crude spent the last 5 years, would be a 50% return from the current $50 level. It seems like that could happen nearly overnight without anyone really thinking much about it.

So how do you play a bounce in Oil?

Well, the most popular play, by size and volume ($1.2 Billion in Assets, $387 million changing hands daily), is no doubt the Oil ETF (USO). But is that really the best way to ‘play’ a bounce?

Consider that USO Is designed to track the “daily” movement of oil. What’s the matter with that? One would hope that the ETF closely matches the daily move of Oil, right? Well, yes and no. Yes if you are going to buy the ETF for one day, or even a couple of days; no if your investment thesis is oil prices will climb higher over an extended period of time. Because, and here’s where it gets tricky – USO’s long term price appreciation won’t match the sum of its daily price appreciations. How is that possible?

You see, the ETF works by buying futures contracts on Oil, and there are 12 different contracts in Crude Oil futures each year, you guessed it – one for every month. And while the so called ‘front month contract’ is trading near the number you see on the news every night ($50 yesterday), the further out contracts, such as 10 to 12 months from now, may already reflect the idea that Oil prices will be higher.

Indeed, the price for the December 2015 contract is $57, versus $50 for the front month. So there’s $7, or a 14% gain, already “built in” to the futures price. What’s that mean for the ETF investor? Well, if you are correct that Oil will rebound, and it does so, to the tune of rising 14%, or $7 per barrel, over the next 11 months; the ETF likely won’t appreciate 14% as well. It likely won’t move at all, because it will have to sell out of its expiring futures positions and buy new futures positions each month. This means it will essentially have to “pay” that $7 in what’s called “roll costs”.

This is why $USO has drastically underperformed the “spot price” of Oil over the past five years, with $USO having lost -39% while the spot price of Oil went UP 48%. It is like an option or insurance premium – a declining asset with all else held equal. Just look at what happened during the last big rally for energy prices between January 2009 and May 2011. That’s a 110% difference between what you thought was going to happen and what the ETF rewarded you with.

For the full article from ValueWalk, click here.


ETF Industry’s 1st Deal for 2015: Nasdaq Acquires ETF firm Dorsey Wright

MarketsMuse update courtesy of ETF.com’s Ollie Ludwig—

Nasdaq, the stock exchange company that’s also pushing deep into the world of indexing, significantly added to its index-provider profile by agreeing to acquire the technical analysis and ETF firm Dorsey Wright & Associates for $225 million in debt and cash on hand.

The transaction, which is expected to close in the first quarter of 2015, will make Nasdaq one of the biggest providers of “smart beta” indexes, Nasdaq and Dorsey Wright said today in a press release. The combined entity will bring together the 17 ETFs Dorsey Wright has its name on as well as Nasdaq’s 69 smart-beta ETFs focused mainly on dividend and income strategies.

Nasdaq Global Indexes will become one of the largest providers of smart-beta indexes, with nearly $45 billion in assets benchmarked to such benchmarks. A total of more than $105 billion is benchmarked to all Nasdaq indexes, the companies said.

The announcement of the transaction comes at a time when the world of smart-beta ETFs is all the rage. Inflows last year into such strategies were estimated to be twice that of flows into ETFs in general, based on the most liberal definitions of what constitutes smart-beta ETFs.

“Smart beta represents one of the fastest growing sectors within the ETF market,” Tom Dorsey, president of Dorsey Wright, said in the press release. “This deal will allow us to grow significantly, while continuing to create products and strategies that meet the needs of our clients.”

For the entire story from ETF.com, please click here