Tag Archives: USO

oil-global-macro-slippery-slope

Oil-Slippery Slope for Traders and Pundits Alike-Except One..

(SubstantiveResearch.com). Trading oil or simply just talking about where, when and why this commodity will assert a more predictable pricing direction has proven to be a slippery slope for professionals and pundits alike. Expressing views via the actual barrel (WTI) or via an ETF (e.g. USO, BNO etc) has been challenging for the best of traders who have spent the last number of months trying to catch a falling knife, or at least pinpoint a trend that doesn’t slip through their fingers. Neil Azous, from global macro think tank Rareview Macro has spent some time this week discussing switching out of his bearish views on oil and its correlated asset classes should the right signals appear.

The idea being that should oil take out last week’s highs (i.e. step 1), and that move is then confirmed by breaking the upside of the downward channel (i.e. step 2), he would start buying the correlated exposure (MSCI EM, high-yield, RUB, TIPS etc). Well, step 2 was breached yesterday, but only on an intraday basis, not on a closing basis. So technically it’s not confirmed, but it is moving in the right direction.

neil azous-global-macro
Neil Azous, Rareview Macro

While Rareview still holds the view that oil may go back and retest, or take out recent low prices before bottoming, Azous has some interesting observations about oil positioning that makes going long enticing. He reckons there is a very clear agenda from the professional community to label the reversal in prices as the long awaited bottom in crude oil and that there is now a genuine exercise underway to engineer higher prices by joining the long crude oil position. Of course the idea that OPEC and non-OPEC may co-opt in production cuts takes this a step further, but it’s just wishful thinking at this stage. Azous goes on to discuss CTA positioning, expectations for IMMs later today, oil’s correlation with the MSCI, which will be of interest to those looking to put on an actionable proxy trade/hedge related to the above narrative.

Click the below link to access Rareview’s archive, or to receive this report.

Request publication

Crude Oil-This Global Macro Trading Expert Says This About That

MarketsMuse Global Macro Trading dept. merges with our ETF dept. to provide the following excerpt profiling a compelling and conservative Crude Oil-centric strategy courtesy of global macro think tank Rareview Macro LLC. The following was posted to subscribers of “Sight Beyond Sight” on Wednesday, May 27. Irrespective of subsequent three day’s pricing and trade activity across crude oil marketplace, MarketsMuse editors have determined the strategy proposed by Rareview Macro’s Neil Azous remains ‘evergreen’ (for the time being).

Neil Azous, Rareview Macro

Today we got long on WTI crude oil in the model portfolio. Take it for what it’s worth, but this is the first time we have traded Crude Oil during this entire corrective phase stemming back to last summer. As per the March 18th edition of Sight Beyond Sight, when we put a long crude oil strategy on our watch list for a reduction of the severe contango in the futures curve, we are finally comfortable with the risk profile, especially considering volatility has been reduced by more than half since then. Sadly we did not deploy a position on March 18th as it coincidentally was the day the “barrel” bottomed.

The reason we chose to utilize a risk reversal approach today to get long on crude oil is because of the pronounced put skew in the term structure. For example, the structure we entered captures seven volatility points of skew on the ask side.

We like the risk-reward in this position. For example, if the November 2015 crude oil future (symbol: CLX5) were to fall $6 in the next one to two months, the strategy stands to lose ~$1.4mm. Conversely, if it were to rise by $6 in the same time frame the expected profit is ~$3.2mm, which returns a profit ratio of 2.28:1.

Sidebar: A similar strategy can be employed in the US Oil Fund (symbol: USO) by buying the 10/16/15 $21.5 calls and selling the $16 puts, but the ETF position is vulnerable to the shape of the futures curve moving further into contango. Continue reading

ETFs To Watch This Week Include ETFs Involved In Oil and The Yen

MarketsMuse blog update highlights the must watch ETFs for the first week of June. The ETFs range from health care, to oil, the Japanese Yen. This update is courtesy of the Benzinga’s author, David Fabian, and his article, “Healthcare, Yen And Oil ETFs To Watch This Week“, with an excerpt from the article below.

The summer months are often characterized by lower volume and heightened volatility, which seems to be a trend that has already established itself this year.

Several important events this week have the potential to impact the market including: personal spending, motor vehicle sales and non-farm payroll data.

Here are the key ETFs to watch for the week of June 1:

Health Care Select Sector SPDR XLV 0.25%

Healthcare stocks have continued to show tremendous strength this year and XLV has been one of the leading sector components of the S&P 500 Index. This ETF is made up of 57 large-cap stocks in the pharmaceutical, biotechnology and medical services fields. Top holdings include well-known companies such as Johnson & Johnson JNJ 1% and Pfizer Inc PFE 0.9%.

CurrencyShares Japanese Yen Trust FXY 0.1%

After appearing to stabilize through the first four months of the year, the Japanese yen currency has once again plunged markedly lower versus the U.S. dollar in May. FXY tracks the daily price movement of the yen versus the U.S. dollar and is down 3.64 percent so far this year.

United States Oil Fund LP (ETF) USO 3.83%

Crude oil prices jumped 4 percent on Friday and managed to recoup the majority of the slide this commodity experienced in May. USO tracks the daily price movement of West Texas Intermediate Light Sweet Crude Oil futures and is the most heavily traded oil ETF.

To continue reading about why oil, the yen, and health care are must watch ETF categories according Benzinga reporter, David Fabian, click here.


Oil ETF Investors Race For The Exits

After pouring more than $6 billion into oil ETFs, investors are looking for a quick exit for two reasons: 1) the oil rebound might take much longer than originally expected and 2) the contango market is becoming an even bigger factor. This MarketsMuse blog update is courtesy of Reuters’ article “Look out OPEC! Oil ETF investors head for exit, risking new slump” with an excerpt below.

Oil investors who amassed a $6 billion long position in exchange traded funds, occupying as much as a third of the U.S. futures market, are now racing for the exit at a near record pace.

Outflows from four of the largest oil-specific exchange traded funds, including the largest U.S. Oil Fund (USO), reached $338 million in two weeks to April 8, according to data from ThomsonReuters Lipper. That is the first two-week outflow since September and the biggest since early 2014, marking a turnaround from heavy inflows in December and January on bets that oil prices would quickly rebound from six-year lows.

If the exodus gathers pace it could signal new pressure on crude oil prices that had begun to stabilize at around $50 a barrel this year following their 60 percent plunge, says John Kilduff, a partner at energy fund Again Capital LLC in New York.

Retail investors may have been “trying to bottom fish and got washed out with the recent new low,” he said.

To continue reading about the possibility of a new oil slump from Reuters, click here

How One Smart Prop Shop is Trading Oil ETFs

MarketsMuse blog update courtesy of extract from 27 Feb story from ETF.com’s Elisabeth Kashner and her profile of prop trading firm Virtu, the high-frequency (HFT)“Virtu’s HFT Way To Play Crazy Oil Market”


Elisabeth Kashner, ETF.com

Would you ever sell something to yourself and pay someone else to be the middleman? Nobody’s that dumb, right?

Virtu, the high-frequency trading firm (HFT) of the type profiled in “Flash Boys,” did just that, to the tune of $32 million.

High-frequency traders are perhaps the most sophisticated players on Wall Street. Some might be scoundrels, but they’re not fools. That’s why their recent trades in oil futures-based ETFs are so fascinating.

Like hedge funds and mutual funds, HFT firms keep their portfolios under wraps, except when the Securities and Exchange Commission requires disclosure.

Virtu’s most recent form 13F, the Securities and Exchange Commission’s quarterly holdings report, revealed a $46 million position in United States Oil (USO | B-100) at the close of business on Dec. 31, 2014. USO buys front-month oil futures. By the end of 2014, with oil prices at a 10-year low, USO shares had taken a beating, as you can see in the chart below.   Continue reading

Philippines Has Rising Star in the ETFs Market

MarketMuse update courtesy of ETF Trends’ Todd Shriber.

After finishing lower for a second consecutive year in 2014, diversified emerging markets exchange traded funds are off to decent though not spectacular starts in 2015.

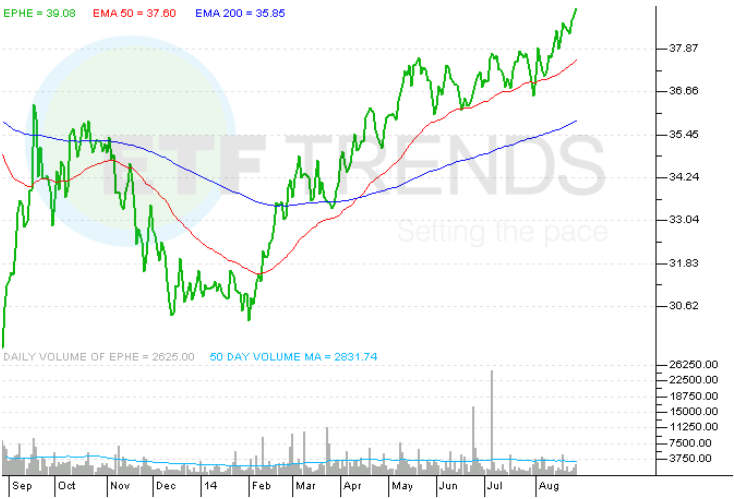
Off to a more impressive start than broader peers, such as the iShares MSCI Emerging Markets ETF (NYSEArca: EEM) and the Vanguard FTSE Emerging Markets ETF (NYSEArca: VWO), is the iShares MSCI Philippines ETF (NYSEArca: EPHE). EPHE, the lone Philippines ETF, entered Friday with a 2015 gain of 2.6%, or nearly quadruple that of VWO.

In 2014, EPHE gained more than 22% while EEM and VWO each finished the year in the red. EPHE now resides less than 10% below its all-time high set in January 2013 and more gains could be on the way after stocks in Manila rose to a record during Friday’s Asian session.

Like India, the Philippines is getting a significant economic boost from lower oil prices because the Philippines is dependent on oil imports to help power one of Southeast Asia’s fastest-growing economies. Over the past six months, the U.S. Oil Fund (NYSEArca: USO) has plunged 51%, but the WisdomTree India Earnings Fund (NYSEArca: EPI) and EPHE have traded modestly higher over that period.

Investors are paying up to be involved with Philippine equities.

“Shares in the Philippine Stock Exchange Index are valued at 18.4 times 12-month estimated earnings, the highest since Nov. 26. The gauge has the highest multiple among Asia’s benchmark equity indexes,” reports Michael Patterson for Bloomberg.

The MSCI Emerging Markets Index trades at about 11 times earnings, but that did not prevent EPHE from hauling in $44.3 million in new assets last year. That is nearly 12% of the ETF’s current assets under management, indicating U.S. investors remain underweight Philippine equities. That may not be the case for long.

“The Taiwanese, Philippine and South Korean stock markets also warrant over-emphases on account of their stable political regimes, reliable policymaking climates and healthy economic prognoses,” said S&P Capital IQ.

For 2015, Morgan Stanley “said the Philippines was the best-positioned market due to its ample liquidity, strong forecast gross domestic product growth and low levels of credit penetration,” reports The Star.

A stronger U.S. dollar is helping Philippine stocks beyond lower oil prices. Foreign remittances are now worth more when converted into pesos, helping boost the local economy. EPHE allocates nearly 12% of its weight to consumer sectors.

In fact, the Philippines has already issued dollar-denominated bonds this year, becoming the first emerging market to do so. The Philippines can afford to do that because its external funding costs are low relative to other developing economies and the country has an investment-grade rating from all three major ratings agencies.

For the original article by Todd Shriber from ETF Trends, click here.

Finally! Now You Know How to Play the Oil ETFs

MarketMuse update courtesy of ValueWalk.

It’s the first (real) week back from holiday break, but the story is the same as it was before Christmas, and before Thanksgiving for that matter…. Crude Oil continues to fall like a lead oil filled balloon, falling below the $50 mark on Monday for the first time since 2009. It’s even gotten to the point of family and friends asking where we think Crude Oil will bottom at parties and dinners, getting our contrarian antennas perked up.

The million, or actually Trillion, dollar question is where will Crude finally find a bottom and bounce back? Fortune let us know recently that the $55 drop in Brent Oil prices represents about a Trillion dollars in annual savings.

Now, while some are no doubt betting on continued downside with the recent belles of the ball – the inverse oil ETFs and ETNs ($DTO) ($SCO) ($DWTI), the last of which is up a smooth 527% since July {past performance is not necessarily indicative of future results}. Others are no doubt positioning for the inevitable rebound in energy prices, thinking it is just a matter of when, not if. Crude Oil is back around $70 to $100 a barrel. And what a trade that would be. Consider a move back to just $75 a barrel, the very low end of where Crude spent the last 5 years, would be a 50% return from the current $50 level. It seems like that could happen nearly overnight without anyone really thinking much about it.

So how do you play a bounce in Oil?

Well, the most popular play, by size and volume ($1.2 Billion in Assets, $387 million changing hands daily), is no doubt the Oil ETF (USO). But is that really the best way to ‘play’ a bounce?

Consider that USO Is designed to track the “daily” movement of oil. What’s the matter with that? One would hope that the ETF closely matches the daily move of Oil, right? Well, yes and no. Yes if you are going to buy the ETF for one day, or even a couple of days; no if your investment thesis is oil prices will climb higher over an extended period of time. Because, and here’s where it gets tricky – USO’s long term price appreciation won’t match the sum of its daily price appreciations. How is that possible?

You see, the ETF works by buying futures contracts on Oil, and there are 12 different contracts in Crude Oil futures each year, you guessed it – one for every month. And while the so called ‘front month contract’ is trading near the number you see on the news every night ($50 yesterday), the further out contracts, such as 10 to 12 months from now, may already reflect the idea that Oil prices will be higher.

Indeed, the price for the December 2015 contract is $57, versus $50 for the front month. So there’s $7, or a 14% gain, already “built in” to the futures price. What’s that mean for the ETF investor? Well, if you are correct that Oil will rebound, and it does so, to the tune of rising 14%, or $7 per barrel, over the next 11 months; the ETF likely won’t appreciate 14% as well. It likely won’t move at all, because it will have to sell out of its expiring futures positions and buy new futures positions each month. This means it will essentially have to “pay” that $7 in what’s called “roll costs”.

This is why $USO has drastically underperformed the “spot price” of Oil over the past five years, with $USO having lost -39% while the spot price of Oil went UP 48%. It is like an option or insurance premium – a declining asset with all else held equal. Just look at what happened during the last big rally for energy prices between January 2009 and May 2011. That’s a 110% difference between what you thought was going to happen and what the ETF rewarded you with.

For the full article from ValueWalk, click here.


Option Traders Aim For More Declines in Junk Bond ETFs

MarketsMuse update courtesy of extract from ETFtrends.com column by Senior Editor Todd Shriber..

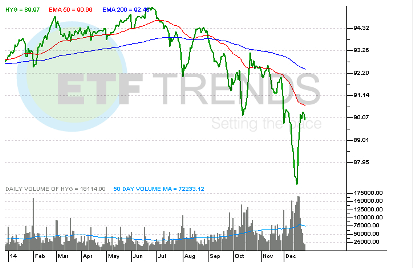
ETFTrends-logoExchange traded funds holding high-yield debt have stumbled this year due in large part to sliding oil prices. Some options traders are betting on further declines for the iShares iBoxx $ High Yield Corporate Bond ETF (NYSEArca: HYG), the largest junk bond ETF.

Options hedging against swings in HYG “cost the most since 2010 versus those on an ETF following Treasuries and were at an almost six-year high relative to contracts on a Standard & Poor’s 500 Index fund,” report Inyoung Hwang and Jonathan Morgan for Bloomberg.

HYG is off 3.1% this year, but the ETF’s declines and those of its rivals have worsened in the back half of the year as oil’s slide has gained speed. HYG is off 5.6% over the past six months as the United States Oil Fund (NYSEArca: USO) has plunged nearly 47% over the same period.

The message from the options market regarding HYG is clear: More declines are on the way.

“About 56,000 bearish and bullish options changed hands daily on average in December, compared with an annual mean of less than 23,000 through the end of November,” according to Bloomberg.

As oil prices have tumbled, high-yield corporate bond investors have become skittish due to the rising influence of the energy sector within the U.S. junk bond market. Energy issuers account for 15% of the U.S. high-yield market, up from less than 10% seven years ago. [Oil Will Drag Junk Bond ETFs Down]

Oil and gas issuers account for 13.5% of HYG’s weight, the ETF’s second-largest sector allocation behind a 14.9% weight to consumer services.

Then there is the matter of increased leverage. At the end of the second quarter, U.S. shale producers had a total of $190.2 billion in debt, up from less than $150 billion at the end of 2011, according to Bloomberg data.

For the entire story from ETFtrends.com, please click here.

Mr. Shriber has been involved with financial markets for over a decade and has been writing about ETFs for over seven years. Prior to joining ETF Trends, Mr. Shriber was the chief ETF analyst at Benzinga. His written work has appeared on MarketWatch, Minyanville and Investopedia, among other web sites and major daily newspapers such as the New York Times and Washington Post.

Junk Bond ETFs: SOS for HY Sector ($USO, $XOP, $JNK, $HYG)

etf-logo-finalBelow extract is courtesy of Oct 13 edition of ETFtrends.com and senior editor Todd Shriber

The United States Oil Fund (NYSEArca: USO) is off 6.4% in the past month as West Texas Intermediate, the U.S. benchmark oil contract, ominously descents to $80 per barrel.

Oil’s slide has wrought havoc for futures-based ETFs, such as USO, as well as scores of equity-bae funds with energy sector exposure. After a 9.5% third-quarter loss, was once the top-performing sector in the S&P 500 earlier this year has now turned into one of the worst groups. [Dour View on Energy ETFs]

Of the 25 worst-performing exchange traded funds over the past month, 12 are equity-based energy funds. However, weakness in the energy sector could be problematic for some an asset class some investors may not be overlooking as a victim of energy’s slide: High-yield bonds and the corresponding ETFs.

Booming production at the Eagle Ford Shale and other shale formations has helped make Texas the envy of large state economies. That same theme has also been viewed as one of the more favorable long-term catalysts for ETFs ranging from the SPDR S&P Oil & Gas Exploration & Production ETF (NYSEArca: XOP) to the Market Vectors Unconventional Oil & Gas ETF (NYSEArca: FRAK), but oil’s decline is threatening producers ability to profitably tap North American shale plays. [Fracking ETFs Foiled by Slumping Oil Prices]

“Texas is the anchor to shale production, employment growth, positive real estate trends, and overall positive moral. With Crude Oil at or below the cost of production for many project, the State with the highest economic multiple needs to contract,” said Rareview Macro founder Neil Azous in a research note.

But there’s more, including the threat falling oil prices pose to the high-yield bond market. Continue reading

ETF Branding: What’s In The Name Might Not Be in the Index

Courtesy of Karen Damato, WSJ Reporter

Most ETF names appear to leave little to the imagination. They seem to describe what the fund is all about.wsjlogo

But beware: Sometimes you can’t judge an ETF by its cover.

A “Middle East & Africa” fund with only 5% of assets in the Middle East? A “BRIC” fund—you know, for Brazil, Russia, India and China—that has just 2% of its assets in Russia? A “homebuilders” fund that has only 26% of its assets in companies that build homes?

Yes, that’s right.

In many cases, the ETFs are simply aping the names of the indexes they track, so the issue is more one of index composition than duplicitous marketing. But “a misleading name is a misleading name,” says Robert Goldsborough, an ETF analyst with investment researcher Morningstar Inc. And “the first thing anyone sees about an ETF is the name.”

ETF sponsor State Street Global Advisors, a unit of State Street Corp., recently noted in an online checklist designed to help investors analyze ETFs that “many ETFs belie their name.” Thus, “it’s necessary to look beyond the fund’s name or the index it tracks” to analyze the underlying holdings.

Some questionable names are found in State Street’s own lineup, researchers say. IndexUniverse points to SPDR S&P Emerging Middle East & Africa, GAF -1.89% an $88 million ETF that recently had 91% of its assets in South Africa, 4% in Morocco and—for its Middle East exposure—5% in Egypt. Egypt is the only Middle East country that Standard & Poor’s classifies as an “emerging” economy.

Mr. Goldsborough takes issue with State Street’s $2.2 billion SPDR S&P Homebuilders XHB +0.15% . It recently had 74% of assets in companies that are related to but not directly engaged in home building, such as top holdings Whirlpool Corp. and Lowe’s Cos.

A State Street spokeswoman didn’t respond to requests for comment. Continue reading

HARD is On:Currency-Centric ETF

by Cinthia Murphy

United States Commodity Funds, the firm behind the $1.25 billion U.S. Oil Fund (NYSEArca: USO), filed paperwork with U.S. regulators to market its first currency fund, this one a futures-based currency ETF that would serve up exposure to a basket of five currencies at a time.

The U.S. Golden Currency Fund (NYSEArca: HARD) is a commodity pool comprised of futures contracts that represent equally weighted interest in five hard currencies that are widely used, easily exchangeable and issued by an economically strong country, the company said. The portfolio, which is rebalanced monthly, will have an estimated annual fee of 0.85 percent, including 0.60 percent in management fees.

The base currency for the strategy is the U.S. dollar, and therefore the dollar is not eligible to be one of the five currencies in the mix, the prospectus said.

Instead, the fund will select its exposure annually from the 25 most actively traded global currencies as measured every three years by the Bank of International Settlement currency trading report, the filing said. The latest BIS list, which was published in 2010, had the U.S. dollar, the euro, the Japanese yen, the British pound, the Australian dollar and the Swiss franc at the top. Continue reading