If you’ve been a professional trader for ‘more than 15 minutes’ (i.e. years, if not decades), you know the equities markets will move lower when (a) complacency prevails, a sense of calm is seemingly endless and equity market indices quietly creep higher and higher or (b), business news front page stories profile ‘amateur day traders’ who are minting millions of dollars by betting against volatility, and ‘selling short’ the risk of increased volatility by using VIX-centric products to capitalize on the complacent nature of markets. If this were a high school history class (or an advanced math lesson titled “revert to the mean”), the correct answer to above would be both (a) and (b). That said, professional traders who have ‘seen it all’ and are programmed to take a contrarian stand –in this case, by betting against complacency- have been suffering for months, both intellectually and P&L wise.
But when the front page of the NYT business section profiles home grown trading wizards, including a twenty-something former store manager at Target Corp who quit his day job to become a day trader, and has since made as much as 20x his prior annual income (and accumulated an eight-figure nest egg) “simply” by selling short new-fangled “VIX-flavored” financial instruments-those that measure market volatility, its no surprise that a shoe will drop and hit those folks in the head quickly and decisively. Not to suggest that MarketsMuse curators were shocked this morning when, after finishing their read of the aforementioned NYT story, US equity markets sold off by nearly 1% in early Tuesday trading. The question becomes, why is today different than other day within the context of the past 9 months, when equity market sell-offs have had a shorter shelf life than a freshly made souffle?
Out of every crisis comes opportunity, and Hurricane Harvey portends to provide a re-building boon for those areas in Texas that have been tormented by one of the country’s greatest natural disasters. Prospectus.com provides a full menu of feasibility study services for entrepreneurs who will be working to make Houston, Austin and surrounding areas great again.
US Equities, along with a discrete universe of non-US equity markets have been in a north bound trajectory for multiple months, despite ever-increasing geopolitical concerns and crises that have not merely seemingly right-minded global macro investment strategies, but have confounded highly-trained portfolio managers focused on equities markets and nearly every other asset class. Existential threats to the equities markets are served for breakfast, lunch and dinner every day, and include but are not limited to North Korean missile launches, catastrophic environmental events (e.g Hurricane Harvey), terror-wreaking incidents advanced by a faction of fools who have hijacked the Islamic faith and actually believe that after blowing themselves up, they will spend eternity with 7000 virgins as a reward, and of course, the chaos-inducing cackle that comes straight out of the mouth of the current US President–aka He-Who-Must-Not-Be Named further as it will only enhance his ‘ratings’.
Who do you call to distill whether equities markets are actually poised to ‘revert to the mean’ after achieving 20% gains in less than 12 months? MarketsMuse curators who connect with top gun traders and investment managers (and have collectively spent multiple decades working in/around trading desks on both sides of the aisle) have a default go-to investing guru. Will our favorite top gun, who advances a uniquely RareView have all of the right answers all of the time? Most likely not, but its better to be right more often than wrong, and better still to achieve solid performance on a consistent basis vs. flying blindly with the notion ‘keep calm and carry on’ , especially when that approach inevitably leads to undesirable outcomes..
If you’ve got a hot insider tip, a bright idea, or if you’d like to get visibility for your brand through MarketsMuse via subliminal content marketing, advertorial, blatant shout-out, spotlight article, news release etc., please reach out to our Senior Editor via cmo@marketsmuse.com.
Exchanges Battle Each Other to Create Competing Fear Index Products, out of fear of losing market share.
Another index product to “measure” investors’ fear?? Are they bats?! As MarketsMuse Chief Curator says, “Yes, Matilda, I’m afraid to say there is yet another new fear index” intended to compete with the now famous VIX product. Dubbed SPYIX (pronounced “Spikes”) by its creators (a joint venture between electronic exchange operator BATS Global Markets and research provider T3Index, the index tracks the price of options linked to the world’s biggest exchange-traded fund, the SPDR S&P 500 ETF Trust.
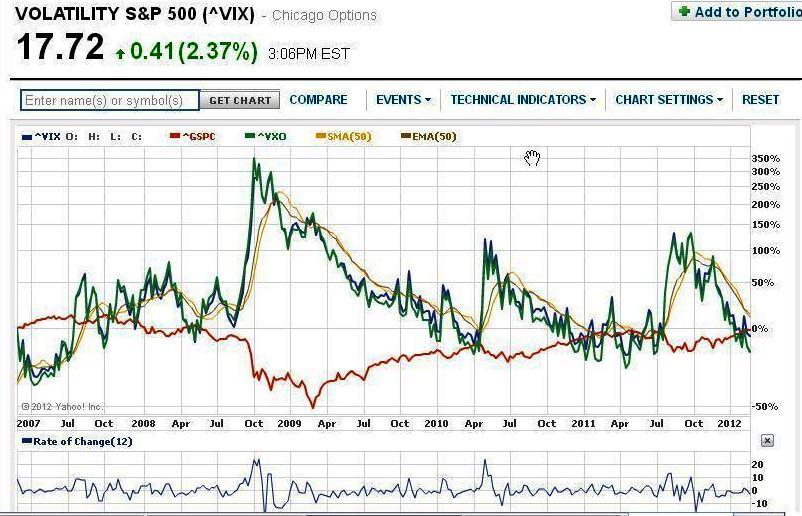
When equities markets are more volatile than ‘normal’–which inevitably means share prices are nose-diving or as my investing grandmother would say “in the midst of a price correction”, tsuffice to say most investors sh*t the bed with fear when the. Despite the fact that CBOE, owner of the VIX trademark aka Chicago Board Options Exchange Volatility Index says that “VIX measures expectations for price volatility in the Standard & Poor’s 500 Index during the next 30 days”–that definition is often off-base. Professional options traders will stipulate that VIX is not much more than a real-time diaper check that measures people’s current level of fear, and that index can be 50% lower (or higher) within a matter of hours, once the panic that triggered a spike in the index settles down (or becomes even more magnified thanks to an overnight event that leads investors to liquidate positions the following day).
Here’s the excerpt from Bloomberg LP coverage-
Bats Global Markets Inc. is introducing its own volatility benchmark for U.S. stocks called the Bats-T3 SPY Volatility Index, an attempt to muscle in on CBOE Holdings Inc.’s VIX territory. Dubbed SPYIX (pronounced “Spikes”) by its creators, the index tracks the price of options linked to the world’s biggest exchange-traded fund, the SPDR S&P 500 ETF Trust.
Though they’re calculated in different ways, the indexes are similar enough that the price of the SPYIX should closely resemble the VIX, one of the most closely watched benchmarks in finance.
Creating a successful index could open the door for Bats, which is planning an initial public offering, to create its own options products. The fiercely competitive equity-trading business has compelled exchange operators to seek alternative sources of revenue.
The core of the Bats sales pitch is automation. While trading pits where business is done in person are largely extinct, some options used to calculate the VIX are still transacted by human traders at CBOE’s market in Chicago. The SPYIX is derived from options bought and sold electronically. Bats argues that this means its product would have stayed online on Aug. 24, when CBOE’s index was unavailable for 30 minutes because of enormous market volatility.
“The SPYIX is designed to withstand the most turbulent market conditions,” according to Bats, which developed the new benchmark with T3Index.
MarketsMuse followers have been reminded more than a few times that conventional wisdom requires investors to keep their eyes on corporate bond spreads so as to have a clear lens when considering the outlook for equity prices on a medium-to-longer time frame. The relationship between high-yield debt,most-often measured by HYG (the high-yield bond exchanged-traded fund) and VIX–the latter of which is an often misunderstood metric, is a telling indicator for stock investors. And, those who are experts at reading the tea leaves are pointing to red flags on the horizon..
Courtesy of CNBC, Neil Azous of Rareview Macro and Andrew Burkly of Oppenheimer, two of the industry’s most sensible pundits discuss the cause and ramifications of the recent junk bond sell-off, pointing to high yield bond ETF $HYG as a meter benchmark to in the video below..
MarketsMuse Strike Price curators are always looking for smart perspectives on how to bring more asset managers and institutional investors to better understand and embrace the use of options in a responsible manner. According to Todd Hawthorne, lead portfolio manager of Boston Partners, volatility [which some immediately and sometimes, misguidedly associate with the CBOE VIX Index], has created a new asset class for institutional and retail investors, and like all other asset classes, there are opportunities to harvest returns. In this case, the tools to implement volatility strategies are found via the use of options contracts.
Todd Hawthorne, Boston Partners
In a recent submission to Pensions & Investments, Hawthorne writes, “These volatility strategies, when viewed as their own discrete asset class, are designed with the goal of delivering returns that are in line with historical assumptions for equities while maintaining a far narrower range of performance (i.e., a substantially higher Sharpe ratio) and downside protection that can limit losses. Moreover, in a market in which yield has become difficult to find, the construct of equity buy/writes, coupled with bottom-up fundamental analysis, can create a synthetic yield instrument that delivers uncorrelated returns and manages to capitalize on volatility rather than being subjected to it.”
Adds Hawthorne, “Traditionally, when retail investors discuss “low volatility” strategies, they are referring to an approach that combines diversification with systematic and regular rebalancing. These more traditional approaches — be it Shannon’s Demon, the Kelly Criterion, or other variations — are more about circumventing volatility than actually capitalizing on it with true downside protection and improved return profiles…
However, other strategies that combine both equities and equity call options — or buy/write securities — can more effectively “harvest” returns out of swings in sentiment, while providing more predictable, and often better, performance even as volatility ramps up. The concept of creating synthetic yield isn’t necessarily new, as portfolio managers will often invest in buy/writes on a basket of stocks tied to an index as a way to generate returns that are in line with the market over time, but at slightly reduced volatility and with the added benefit of options income..”
MarketsMuse Global Macro merges with Strike Price seers with sage excerpt from 18 Sept edition of “Sight Beyond Sight”, the daily newsletter published by global macro think tank Rareview Macro and authored by Managing Member Neil Azous and rising star Michael Sedacca…For fans of the film Draft Day, this excerpt will resonate in a resounding way..For those who option traders who understand what VIX really is, and respect ideas that make sense, the following is a solid read.. The entire SBS edition can be found via link below..
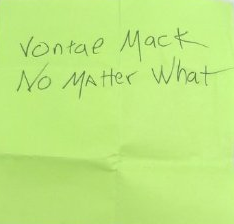
Volcano Trade Cont. – No Matter What, Vontae Mack
Neil Azous, Rareview Macro
Today, we are going to use a metaphor from a football movie to get our point across. Please note we expect to receive significant push back in this view, given we are going against the grain here. We are prepared for whatever you want to throw at us.
The movie, Draft Day, starring Kevin Costner, was an interesting (supposed) peek into the shrewd world of power plays among National Football League (NFL) general managers as they jockey to make the best deals on the yearly NFL Draft Day.
What grabbed the attention of viewers was the final, big reveal on a visual tease that ran through the whole movie involving a Post-It note. Kevin Costner’s character, Sonny Weaver, Jr, in only his second year as the General Manager for the Cleveland Browns, is feeling Herculean pressures from all sides – the arrogant owner, the difficult coach, and the even more difficult fans – to elevate the pitiful Browns into a team of national contenders. He has to make big, smart plays, which means we glimpse the political maneuverings at work, the salary cap issue, the various strengths and weaknesses of the key players his staff has been researching, as well as the poker game he must play with other GM’s in the NFL who are playing poker right back at him.
But all along, we see Sonny continually referring to the same little Post-It note he started with earlier that morning before he even left his house. He wrote the note himself, stuck it in his pocket, and then keeps referring to it as the day wears on and the stress level rises.
The draft begins. By making a painful trade that puts the entire future of his franchise on the line, Sonny secures the enviable #1 pick of the first round. Perfect, now he can get the obvious choice, the much-hyped #1 quarterback candidate. Instead, to the astonishment of all he unilaterally chooses the strong, but less regarded linebacker, Vontae Mack.
And this is what touched most viewers. At the end, after weathering the draft day storm, regardless that we all knew Costner would come out on top, it turns out what matters is that Post-It note. When he lays it on the table for the viewer, to finally read, it simply said:
No. Matter. What. He carried it with him all day. He clutched it in his fist when the heat was hottest and the fog was thickest. He fumbled it, strayed from it, even doubted it, but in the end, that simple determination governed him, guided him, through the storm. When no one supported him or even thought he was sane, the fictional Sonny Weaver, Jr, had one thing, his No Matter What.
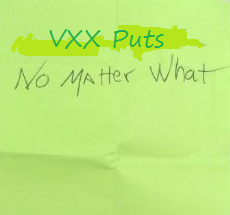
This is how I feel about the VXX put options we hold in the model portfolio.
You can insert CNBC in place of the Cleveland fans, my inner circle of trusted advisors in place of the coach, and our paid subscribers as the arrogant owner. But at the end of the day, we want to see how these moves lower in volatility plays out into next week. While we know we can book an additional 30-60 bps of PnL in the model portfolio in short order, we are looking to make a significantly larger amount if volatility continues to come in at the pace that has been witnessed over the last few days. The key point being, if VXX closes at 18 next Friday the below Volcano Trade would contribute an additional +4% to the NAV, on top of the 60 bps already realized. That is an opportunity we can’t ignore and we want to be a pig about it.
Yesterday before the Federal Reserve monetary policy statement we adjusted our short US equity volatility position for a second time.
Below is the sequence of trading events since the inception of this strategy but as a reminder the definition of the “Volcano Trade” is as follows: After an asset has had a large move in your favor and the option you own approaches a ~70 delta, you are able to roll the position to an out-of-the-money strike in two or three times the size, and capture an increasingly larger amount of profit if the move continues.
September 1st: Bought 10,000 VXX 9/18/15 $25 put options for $0.95 (VXX spot reference ~$30.50)
September 15th:Volcano Trade
Sold 10,000 VXX 9/18/15 $25 put options at $1.61 (vs. 0.95 cost basis)
Bought 20,000 9/18/15 $23.50 put options for $0.78 (VXX spot reference ~$24.20)
Net Credit: $0.03 or $30,000
September 17th a.m.:Super-Volcano Trade
Sold 20,000 VXX 9/18/15 $23.5 put options at $1.76 (vs. $0.78 cost basis)
3,520,000 premium taken in
Bought 30,000 VXX 9/25/15 $20.50 put options for $0.57 (VXX spot reference ~$22.00 at 9:57 a.m.)
Net Credit: $1.81 or $1,810,000
*Locked in 60 bps of PnL to the model portfolio
**The roll and the remaining options are FREE.
September 17th p.m.:Super-Volcano Trade Cont.
Bought 10,000 VXX 9/25/15 $20.5 put options for $0.36 (VXX spot reference $22.80 at 4:10 p.m.)
Current position: 40,000 VXX 9/25/15 $20.5 put options for $0.5175.
*Playing with House Money: Current premium $2,070,000 or 69 bps to the NAV.
Time Stamp: All updates were sent in real-time via Twitter.
Here are the following reasons for taking these actions:
The FOMC rate decision and approaching expiration date (i.e. today) had caused this week’s options to carry an implied volatility about double that of next week’s expiration.
The notional of the put options reached 150 bps of the model portfolio NAV, which considering they were less than 48 hours from expiration breached our rules-based discipline.
As a result we were able to accomplish three things.
We were able lock in profit whilst keeping a comparable amount of short delta. At the time of the sale we were synthetically short 1.5mm shares of VXX. By rolling the options our new synthetic short position was the equivalent of 835,000 shares.
We increased our gamma exposure to a further decline in US equity volatility by rolling down and out into larger size (i.e. 40,000 put options versus 20,000 put options).
We significantly reduced our vega risk by shifting into options with half of the implied volatility.
So far, this is nothing more than us sticking to our rules-based discipline. In fact, this was “text-book” trading and a classic example of adjusting a position on numerous occasions at the most opportune time. Following the FOMC release yesterday, the VXX even broke below our new strike and traded at $20.04.
Our view remains the same as it did on Wednesday when we introduced the “volcano trade” to you – that is, we expect US equity volatility to continue to decline into the end of the quarter. Additionally, the VIX curve continued to shift towards contango, with it trading inverted for a portion of yesterday’s session.
While headline writers want to suggest that uncertainty around the path of Fed policy is negative for risk assets the fact remains that investors believe lower-for-longer interest rates trumps that view and, as a result, they are not long enough market beta if the bounce back in risk into the end of the quarter continues. After all, that would be the biggest Bronx cheer (i.e. middle finger) of all right now.
We are mindful that hanging around this long may be overstaying our welcome, but hopefully the “volcano” will continue to explode through this new lower-lower strike with four versus two times the leverage since inception and dispense burning lava all over the nearby villages filled with dogmatic perma-bears who are looking for high volatility once again because they did not get unshackled from the Fed handcuffs.
Feel free to turn the CNBC volume to full blast, call our office, or send us angry emails to change my mind. But remember where I am coming from today and what our Post-It note says.
Neil Azous is the founder and managing member of Rareview Macro LLC, a global macro advisory firm to some of the world’s most influential investors and the publisher of the daily newsletter Sight Beyond Sight.
One needs to have ‘been there and seen that’ for at least twenty years in order to have been “loaded for bear” in advance of this morning’s equities market rout. At least one of the folks who MarketsMuse has profiled during the past many months meets that profile; and those who have a true global macro perspective such as Rareview Macro’s Neil Azous have pointed to the credit spread widening during the past number of months as a prime harbinger of things to come. And so they have…
Neil Azous, Rareview Macro
Last night, Neil Azous published one of his finer commentaries in advance of this morning’s global equities market rout and incorporated a great phrase:
“Man looks in the abyss, there’s nothing staring back at him. At that moment, man finds his character. And that is what keeps him out of the abyss.” – Lou Mannheim, Wall Street, 1987
The highlights of last night’s edition of “Sight Beyond Sight” are below…
Big Picture View
S&P 500 View
Asset allocation Requires Swimming Against the Tide – Low-to-Negative Downside Capture
Long German versus Short US Equities (Currency Hedge)
US Fixed Income – Short 2016 Eurodollars
Long European & Japanese Equities (FX hedged), US Biotech and US 10-Yr Treasuries
Long US Energy Sector
Volatility – Sell Apple Inc.; Not the S&P 500 or VIX
Harvesting S&P 500 Index Option Skew
Long Agricultural Call Options
Long US Housing (Hedged)
Technical Mean Reversion – Short EUR/BRL
Long Euro Stoxx 50 Index Dividend Futures (symbol: DEDA Index)
To read the full edition of the Sight Beyond Sight special Sunday (Aug 23 2015) commentary, please click here*
*Subscription is required; a free, 10-day trial is available
Neil Azous is the founder and managing member of Rareview Macro, an advisory firm to some of the world’s most influential investors and the publisher of the daily newsletter Sight Beyond Sight.
Extract courtesy of Spencer Jakab, Wall St. Journal. Full article available via clicking on WSJ logo on left side..
“..Now that volatility has emerged not only as a concept but an investment in its own right, there probably is no putting the genie back in the bottle. And while portfolio managers largely welcome the products, the droves of speculators drawn to VIX notes may be in for a wilder ride than they realize…”
The latest big worry to hit markets is an unusual one: calm. With stock prices high and various gauges of risk low, investors appear to have thrown caution to the wind.
That isn’t entirely true, though. Exchange-traded notes that profit handsomely from market-shaking events have boomed since the financial crisis. But they have two big shortcomings: They may not work as designed in another financial crisis since their value depends on the bank backing them. And due to the way the products work, anyone holding these for the long term will inevitably see their value erode. Continue reading →
Below extract courtesy of this a.m.’s edition of Rareview Macro’s Sight Beyond Sight..(Re-published with permission from Neil Azous)
Neil Azous, Rareview Macro LLC
Here is an aggregation of the various statistics either sent to us from subscribers or we came across during our readings this weekend.
1. Japan Government Pension Fund (GPIG): Apple (AAPL), Exxon and Microsoft have the heaviest weighting in the MSCI Kokusai Index; ~87% of GPIF’s foreign stock holdings follow this benchmark. (Source: Eurofaultlines)
2. As far as we can tell the degree of these inflows have not yet been widely observed by other paid forecasters on the Street. EM Portfolio Inflows Reach New High In May: Our EM portfolio flows tracker indicates that portfolio inflows to emerging economies continued their upward trend of the last several months, reaching the highest level since September 2012, when the Fed launched QE3 (Chart 1). In May, EMs are estimated to have received $45 billion in portfolio inflows from global investors, up from $28 billion in April and $27 billion in March. The May figure reflects $28 billion going into EM bond markets (portfolio debt flows,Chart 2) and $17 billion into EM stock markets (portfolio equity flows, Chart 3). (Source: Institute of International Finance) Report
3. This week the S&P 500 will surpass the 1995-96 record for number of consecutive days in which the index has traded above its 200-day moving average.
4. SPY closed above its upper Bollinger 5 days in a row through Friday. SPY has only closed above its upper Bollinger 4 days in a row 4 times since 2009. (Source: Fat Pitch)
5. Relative Strength Indicators (RSI)
a. The S&P 500 (SPY) 9-day RSI is over 70 = Overbought
b. The NASDAQ (NDX) 9-day RSI is 74 and AAPL’s is 80 = Overbought
c. The Transports (IYT) 9-day RSI is over 77 = Overbought
d. The Semiconductors SOX) 9-day RSI is over 70 = Overbought
6. Since 1950, the DJIA has lost -1.9% and SPX -2.1% in June. The last 20 years have been even weaker. Moreover, the SPX has been down in 11 of the last 16 mid-term elections Junes (Source: Stock Traders Almanac).
7. The VIX has closed below 12 for five straight days, the longest streak at that level since 2007 (Source: Volatility Trader) Continue reading →
Below excerpts courtesy of “Quigley’s Corner”, a daily summary of debt capital market activity from Mischler Financial Group’s Ron Quigley
On the “Backpedal”, “Reverse”, “Renege”, “U-Turn”, “About-Face”…………and the FED
The week’s biggest data point belongs to the release of today’s FOMC Minutes. Here are the major talking points:
o Several Fed officials said “forecasts overstated the pace of rate increases.”
o The FOMC minutes did not mention a “rate rise six months after the end of QE.”
o Most FOMC participants saw inflation rising to the 2% Fed goal.
o Minutes revealed “slack” persisting in the Labor market and a gradual decline in unemployment.
o A continued housing recovery was sighted..
o Several members identified trends that pose financial stability risks.
So, what’s it all mean? Great question, simple answer:
MarketsMuse Editor Note: Yes, the headline and the article are both elementary observations for many; yet there remain many others (including investment managers) who misunderstand the meaning of VIX
Investors seeking to predict the magnitude of share price moves at times of market flux may get a faulty steer from a closely watched “fear gauge”, one of investment banking’s top equity traders has warned.
Citi’s Mike Pringle, global head of equity trading at the third-biggest U.S. bank, told Reuters that the VIX volatility index , is now as much a traded asset as it is a guide to investors seeking protection from losses.
The VIX reflects Standard & Poor’s 500 .SPX options prices and, therefore, expectations of future market moves. The idea is that as people become fearful of losing their money, they are more willing to buy a put option as protection.
At the moment, it remains at very low levels.
“A big mistake the market makes is looking at the VIX as an indicator of stock market risk. Why? Because it’s an asset class and it’s more traded for yield than protection,” Pringle said. “It’s still relevant in extremes, but not in a normal functioning market,” Pringle said.
While persuading others of the VIX’s flaws is not easy, Pringle said Citi’s handling of risk management in equities had been restructured accordingly.
Rather than relying solely on the VIX, Citi traders and clients can turn to their “Central Risk Desk”– through which a large proportion of its trades are routed.
The computer programs that underpin the desk’s activities assess around 60 measures of market stress and timing – from global risk arbitrage spreads to dividends to repo rates – to get a better read on sentiment, behavior and deal timing.
Looked through this prism, there is greater risk currently in global markets than the narrower VIX is suggesting.
The percentage of ETF trading relative to overall volume tends to shoot higher in headline-driven markets when asset classes are moving together on macroeconomic or political events.
That’s exactly what happened on Monday when global markets swooned on fears parliamentary elections in Italy will result in political gridlock. After months of simmering on the back burner, Europe’s debt crisis roared back into the news. [Italy ETF Swings Lower on Berlusconi, Election]
On Monday, ETFs accounted for 32% of overall dollar volume, and there have been multiple sessions in the past week when the share rose above 30%, says Chris Hempstead, director of ETF execution services at WallachBeth Capital.
Chris Hempstead, WallachBeth Capital
“It’s rare when ETF volume goes above 30%,” he said in a telephone interview Tuesday morning.
Hempstead said he has seen the figure approach 40% on some days during the past few years.
“ETF trading spikes when people think events are highly correlated and macro in nature,” he noted. “When stock pickers are having a tough time and market correlations rise, that’s when we see the ETF percentage of overall volume start to creep up.”
For example, trading volume in volatility-linked ETFs soared in Monday’s risk-off attack as investors looked for shelter and hedges. The CBOE Volatility Index has jumped 54% in a week. [Volatility ETF Trading Surges on Market Jitters, VIX]
“When the percentage of ETF trading in markets pops, a lot of it is people putting on trades to hedge bets. It’s not buy-and-hold,” Hempstead said. Continue reading →
CBOE Holdings, buoyed by the phenomenal success of options and futures contracts based on its Volatility Index, is ratcheting up its efforts to broaden their appeal.
“The volatility business is only eight years old, but we see terrific growth,” Ed Tilly, CBOE’s president and chief operating officer, told a gathering of reporters in New York recently. “We see hedge funds, prop trading firms, (commodity trading advisors), insurance companies and other institutional users migrating to the product. It’s very important for us.”
As part of its marketing, CBOE is emphasizing to money managers and traders the growth of liquidity in the instruments and the attractiveness of adding a volatility component to their portfolios.
The exchange operator also plans to provide European institutions with direct access to CBOE matching engines, 24 hours a day, 5 days a week.
The Volatility Index, or VIX, is a measure of the market’s expectation of stock market swings over the next 30 days, as determined by the performance of options on the Standard & Poor’s 500 Index. Trading in both contracts has soared in the past three years, with growth in the futures product especially dramatic.
Last year, average daily volume in VIX futures—traded at the CBOE Futures Exchange—reached 95,000 contracts, up from 5,000 in 2009. Average daily volume in VIX options—traded at the Chicago Board Options Exchange— reached 443,000 contracts, up from 132,000 in 2009. All this while overall options volume fell in 2012 and volatility itself was relatively muted. Continue reading →
VelocityShares is pleased to present the October 2012 Volatility Report, providing insights into the volatility landscape.
Highlights from this report include:
Year-to-Date Performance for the VIX Index is -21%.
Year-to-Date Performance for the S&P VIX Futures Indices:
Short-Term: -74% (SPVXSP)
Mid-Term: -47% (SPVXMP)
Tail Risk: -20% (SPVXTRSP)
VIX spot increased steadily in October, opening at 15.73 before closing the month at 18.40.
VIX Call Option Volume once again reached its second highest levels ever (and the most in over a year) on October 17th, 2012, nearing $850MM traded.
The Short-Term S&P 500 VIX Futures Tail Risk Index (SPVXTRSP) ended the month with a long-vol bias of 23.87% long, its greatest long exposure since June 2012.
Due to Hurricane Sandy, the stock exchange was closed for two days and reopened on October 31st. While a catastrophic event might be the cause of a spike in volatility, the following was observed:.
Short-Term VIX Futures gained 3.62%, which is within one standard deviation of the daily returns observed in October 2012
VIX Futures Dollar Volume on the 31st was greater than its 20-day moving average ($2.7B vs. $1.9B)
ETP Dollar Volume on the 31st was the same as its 20-day moving average ($1.4B each)
VIX Options Trading Volume on the 31st trailed its 20-day moving average (378K vs. 479K)
Even if the WSJ is a bit slow on the uptick re: noticing the recent anomaly in VIX skew volatility that we commented on last week, Chris Dieterich’s WSJ weekend story, “Surge in FIX Futures Volumes Driven By Bigger Risk Appetites” makes note of the fact that last month’s daily trading volume of VIX futures on the CBOE’s Volatility Index was the second highest on record, despite what some trading desks viewed as lackluster overall volumes.
More interesting than the volume spike is the gap between the VIX and near-term futures; the April contract is up 2.2% over the last month and on Friday ended at 23.65. The VIX index closed at 17.29, up 0.2% on the day.
On its face, strategists said this unusually wide gap appears to be a warning sign of an increase in market volatility ahead, as traders pay a higher premium to protect against risk further out. Historically, when VIX futures trade this much above the VIX, a modest rise in stocks follows. That has happened 36 times since 2004, and, on average, the S&P 500 traded about 1% higher 50 days after the initial signal, according to data from Schaeffer’s Investment Research.
Everything went higher today (despite the data during the last minutes into the close); stocks, bonds and fear; a somewhat unique combination of ups. When noticing today’s relatively rare direct correlation between equity market volatility (aka VIX), equity indices and “safe haven” US government bonds, option market veteran David Robbins of WallachBeth Capital says, “The wall of worry is simply growing taller.”
With the benchmark barometers DJIA and SPX continuing to climb past technical and psychological barriers, and now only single digit percentage points away from all time market highs despite the still-fragile (albeit somewhat improving state of the US economy), “its always worth worrying” said Robbins, perhaps explaining the subliminal spikes noticed in outer-month VIX options, and in particular, put options.
Added Robbins, “The skew is always a good clue, and if you look at April and June VIX or VXX options, its clear that market pros are re-framing; the risk of a market pull back increases each week the equities market goes up. There’s always a black swan out there flapping its wings, but its simply more expensive today to hedge that risk than it was last week.


 Extract courtesy of Spencer Jakab, Wall St. Journal. Full article available via clicking on WSJ logo on left side..