Tag Archives: XLU

Global Macro: Decomposing the Move in Yields-The Pendulum Swing

Decomposing the Move in Yields…Global Fixed Income Coming Closer to Decoupling from German Bunds

MarketsMuse Global Macro and Fixed Income departments merge to provide insight courtesy of “Sight Beyond Sight”, the must read published by global macro think tank Rareview Macro LLC. Below is the opening extract from 10 June edition.

Neil Azous, Rareview Macro

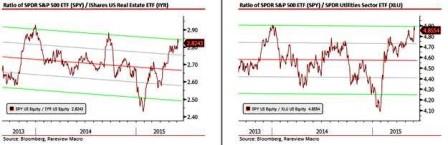
Firstly, please note this morning’s Model Portfolio Update: Crude Oil, XLU/SPY, IYR/SPY, FXI: As per yesterday’s edition of Sight Beyond Sight, we added to existing long positions in Crude Oil, XLU/SPY and IYR/SPY. The update was broadcast in real time via @RareviewMacro.

Now, on to the day’s primary talking points..

The confidence level in the professional community remains low. The attack on the Dollar-Yen (USD/JPY), which had its largest one-day drop since August 2013, was just another casualty of the search and destroy mission underway in overall asset markets. The fact is that there is no model–valuation, technical, or otherwise–that can handicap the speed and the degree of the backup in global yields. The overriding question remains: “When will global yields stop going up, and when can the rest of fixed income decouple from German Bund leadership?”

Risk-Adjusted Return Monitor Summary & Views Continue reading

ETF Trade for Experts Only: Revert to the Mean: IYR, XLU, SPY

“What Goes Up, Must Come Down”

MarketsMuse ETF update is courtesy of a special trade post sent this afternoon to subscribers of “Sight Beyond Sight”, the global macro trade newsletter published by Rareview Macro LLC and authored by Neil Azous.  The trade alert was also posted to Twitter via @RareviewMacro. For those not familiar with the concept of mean reversion, the simplest metaphor that drives the following thesis is “what goes up must come down.”

Neil Azous, Rareview Macro

As highlighted in this morning’s edition of Sight Beyond Sight, the ratio of the iShares U.S. Real Estate ETF (IYR) and Utilities Select Sector SPDR Fund to the SPDR S&P 500 ETF Trust (SPY) is now trading at approximately two standard deviations away from its regression line since US interest rates peaked in September 2013.

rvr jun4

A short while ago in the model portfolio, we initiated a new mean reversion strategy in both of these ratios.

Specifically, we are buying $10 million notional each of IYR and XLU, and selling $20 million notional of SPY over the rest of today at VWAP.

Tomorrow, depending upon the results of the US Labor Report, we will add an additional $10 million notional each of IYR and XLU, and sell an additional $20 million notional of SPY in the morning.

Below is a thesis and trade matrix with a pre-defined game plan for gains and losses. Continue reading

This Expert Says: “RISK OFF re High Yield Bond and Utilities ETFs”

MarketsMuse.com update courtesy of coverage by TheStreet.com

Investors should avoid the Utilities Select Sector SPDR ETF (XLU) despite the recent dovish talk by Federal Reserve Chair Janet Yellen, said Mohit Bajaj, Director of ETF Trading Solutions at WallachBeth Capital. Bajaj added that rising rates will hurt the XLU because power companies are levered to debt financing which will become more expensive. He is also bearish on the SPDR Barclays High Yield Bond ETF (JNK) due to the potential for rising rates and problems in the energy sector. On the other hand, Bajaj is bullish on the Financial Select Sector SPDR ETF (XLF) because the large-cap banks will benefit from rising rates and have passed their stress tests. Below is the video interview..

A Rareview Macro View: “There’s NO Gold in Them Thar Hills”

It was in early 1849 that the director of the Mint at Dahlonega, Dr. M. F. Stephenson spoke from the steps of the mint building in a futile attempt to convince the miners to remain in Georgia to mine rather than to flock to California to chase what might be an impossible dream. “There’s gold in them thar hills, boys,” he shouted as he pointed at the hills surrounding Dahlonega.   

Below commentary is courtesy of today’s a.m. edition of Rareview Macro’s “Sight Beyond Sight”


Neil Azous, Rareview Macro LLC

Gold is showing the largest negative risk-adjusted return across regions and assets.

The pre-market price in SPDR Gold Shares (symbol: GLD) is ~126.40. The volume-weighted-average-price (VWAP) from June 19th until last Friday’s close is 127.0392.

We use June 19th as the starting point because that is when the IRAQ-ISIS conflict registered its loudest decibel level and Brent Crude Oil made its high and Gold broke above the April-May period.

The technical support levels are illustrated below but the first one was breached so far on an intra-day basis. A move closer to 1300 would suggest longs just became trapped. Continue reading

Goldman Highlights ETF Correlations (XLF, XLK, XLU)

By Benzinga.com

In a note out today, Goldman Sachs GS +1.96% said investors are continuing to increase usage of ETFs as hedging tools, a move that is “creating unintended consequences to their portfolios.” Goldman notes that managers and analysts are increasingly creating less-than-desirable hedges due, in part, to surprisingly high correlations among some sector funds.

“We see high trailing 3-month daily correlations among less-than-obvious pairs of sectors, including: Financials & Industrials, Tech & Discretionary and Materials & Discretionary,” Goldman said.

The recent performances of the various Select Sector SPDR funds indicate that Goldman’s note highlights valid points. In the past three months, the Financial Select Sector SPDR XLF +1.43% is down 9.7% compared to 8.8% for the Industrial Select Sector SPDR XLI +0.86% . The three-month gap is wider between the Technology Select Sector SPDR XLK +1.06% and the Consumer Discretionary Select Sector SPDR XLY +0.98% , which are down 5.8% and 3.3%, respectively. Over the past three months, the Materials Select Sector SPDR XLB +1.16% is down 7.5%.

“Indeed, of the 36 sector ETF pairs we examined, correlations on a 3-year basis are higher than 70% for 31 of the instances, emphasizing the importance for portfolio managers to choose sectors wisely when hedging at specific points in time,” Goldman said in the note. Continue reading

Fixed Income ETF Fans Tune In Here

It’s a big bowl of alphabet soup when it comes to quenching your appetite for fixed income ETFs. On today’s menu you’ll find that a small smorgasborg of just these alone will get you through the first of several courses: EUO, UUP, ELD, XLU, IDU.

Ron Quigley

There’s not enough room right here to go into further discussing which of the above fixed-income-flavored ETF(s) will work best, it all depends on which US or geopolitical scenarios you’re trying to feed into. That said, what Ron Quigley says –he’s Mischler Financial Group MD & Head of Fixed Income Syndicate– pretty much sums up what every primary market players’ perspective is this week: “Its good to be selling bonds!!”

Multi-Currency, Sovereign..Utilities..You name it, and the new issuance market says “they’re buying it!”

Reprinted without permission, here’s a 2 paragraph excerpt from tonight’s missive from Quigley to his institutional fixed income patrons:

“..With Consumer Confidence reaching a four-year high coupled with the Greek PSI close to achieving a 85% to 90% participation rate, issuers rode market momentum into what was another prolific day for primary markets.  In total, 11 issuers tapped the dollar markets pricing 16 tranches totaling $8.17 billion.  Thus far the weekly total is $48.55 billion, already placing it as the 3rdbusiest week in history!  With two days left to go, the record of $52.5Bil record may fall.  Among today’s diversified group of issuers were two regulated utilities for Southern California Edison and Consolidated Edison….”

You’ll want to contact Ron directly to see his complete market updates..And, you’ll want to dig into the latest market data behind the above-noted tickers to get the fix you’re looking for.