It was in early 1849 that the director of the Mint at Dahlonega, Dr. M. F. Stephenson spoke from the steps of the mint building in a futile attempt to convince the miners to remain in Georgia to mine rather than to flock to California to chase what might be an impossible dream. “There’s gold in them thar hills, boys,” he shouted as he pointed at the hills surrounding Dahlonega.
Below commentary is courtesy of today’s a.m. edition of Rareview Macro’s “Sight Beyond Sight”

Gold is showing the largest negative risk-adjusted return across regions and assets.
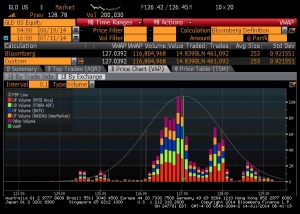
The pre-market price in SPDR Gold Shares (symbol: GLD) is ~126.40. The volume-weighted-average-price (VWAP) from June 19th until last Friday’s close is 127.0392.
We use June 19th as the starting point because that is when the IRAQ-ISIS conflict registered its loudest decibel level and Brent Crude Oil made its high and Gold broke above the April-May period.
The technical support levels are illustrated below but the first one was breached so far on an intra-day basis. A move closer to 1300 would suggest longs just became trapped.

There are many excuses for its renewed weakness but our favorite so far is related to the budget released by the new Indian government late last week. Apparently some investors are surprised that India kept its import duty on Gold and Silver unchanged at 10%. We were not even aware that there was any speculation in the market that India would look to relax its restriction on overseas purchases. To us, that is just one more example of how speculators have been scraping the bottom of the barrel to justify their new long position.
Our second favorite explanation was that in the weekend WSJ, Jon Hilsenrath suggested a “debate is intensifying among the Federal Reserve’s regional bank presidents about whether to push interest rates up from zero sooner than planned because of recent improvements in the U.S. job market, potentially signaling a broader discussion that could change the rate outlook.” While we find this very amusing, and even more misguided than the Indian story, the argument is that speculators were buying Gold in the first place as an inflation hedge on the view that the Federal Reserve would be behind the curve. A second article in less than week from Hilsenrath – the first on employment and the second on this heightened debate – would in theory curtail the view that inflation would not be contained as the FED would not be behind the curve. So Gold is supposed to fall now. Like we said, whatever helps Gold terrorists sleep at night is fine with us, just so long as no one takes it seriously.
On a fundamental and more believable note, a number of paid forecasters either adjusted or reiterated their metals calls, including lower Gold across the board. The two broader takeaways though are that forecasts continue to be increased for base metals in absolute terms and in relative terms, and that within precious metals, both Platinum and Palladium should outperform Gold and Silver.
We remain strategically short Gold and welcome the overnight relief for that position. We also remain tactically long Copper and are looking to turn this into a strategic position by broadening out our base metal exposure (see Watch List update).
We are watching the XLF/XLU ratio closely as it is a core equity position in the model portfolio. At some point, maybe even today, we will an additional 10mm of Utilities (XLU) to make our ratio spread even in notional terms. Right now we are long 2 units of XLF and short 1 unit of XLU.
On a related note, per the Fed’s H.8 (week ended 7/2), loans jumped (+$24.8bn), marking their strongest weekly increase since the final week of 2012. Specifically, a sector we watch closely as an example of cyclicality, Commercial & Industrial (C&I) led the way (+$14.3bn). This should bode well for the regional banks in the intermediate term and with Crude Oil retracing a fair amount might even embolden some to buy the discretionary sector.
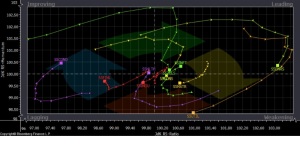
Below is a Relative Rotation Graph (RRG) for the 10 sectors in the S&P 500. As you can see, Discretionary (symbol: S5COND) just entered the improving quadrant, Financials (symbol: S5FINL) are about to shift to Improving from Lagging, and Utilities (symbol: UTIL) are still weakening.

We could only imagine what will happen if Janet Yellen in her testimony to Congress this week is not as dovish as everyone thinks she will be. That would be a very pleasant surprise for those running long Financials versus short Utilities, and also with a long US Dollar bias, such as ourselves.
Current Strategies
Strategic (S):
1. Long US Dollar
2. Long China equities
3. Long US equity buyback, dividends, dividend growth rate, & onshore revenues
4. Long US Financials vs. short US Utilities sectors
5. Long US Small Cap vs. short US Mid Cap Homebuilders
6. Long Apple
7. Short Gold
Tactical (T):
1. Long Copper
2. Short Japanese Equities
Rareview Macro LLC is the Stamford, CT-based macro-strategy think tank and publishes Sight Beyond Sight, a daily, subscription-based enewsletter whose readers include leading investment managers and sophisticated, self-directed investors. The publication incorporates a model portfolio that is updated daily and model portfolio updates are published in real-time via @rareviewmacro. Free, 15-day trial subscriptions (no credit card required) are available via www.rareviewmacro.com
