Tag Archives: mott capital

bull market or bear market

Rumors of Bull’s Demise Exaggerated?

In our April 16 post, “From Bubble to Bloodbath,” we noted the S&P 500 ($SPX) was already down 10% YTD, after falling nearly 19% from the 2025 peak of 6100 to a closing low of 4982.

This 40-year trading veteran (along with other market observers) called it: a bear market had arrived.
Within two days — after another 2% drop — US equities staged a near-5% rally.

WTF is going on?

For those of us trading since the turn of the century, the answer is partly historical: bear markets have become progressively shorter. Whether during the GFC or the pandemic, the Fed was first blamed for selloffs, then credited for bailouts. Meanwhile, the “Battle of the Transformers” — algorithm-driven trading — fuels rapid selloffs and even faster rebounds. (Anyone remember the Flash Crash of 2010?)

More context:

  • Since 2000 through YTD 2025, the S&P 500 has seen 17 years with intrayear drawdowns of 10% or more.
  • Only 6 of those years closed lower: 2000, 2001, 2002 (DotCom Bubble), 2008 (GFC), 2018 (Fed tightening crash), and 2022 (Inflation bear).
  • 17 of those years ultimately posted positive returns.
  • 2025 remains undecided.

Factoid fans, take note:
No prior year has seen Wall Street analysts flip their year-end forecasts so violently — from “up 10%+” to “down 10%” within a three-month window.
Now, 98% of the Street that slashed SPX targets to 5400–5800 will likely flip again — with $SPX just 3%-5% below the “best case” targets pitched by the top 10 banks earlier this year.

Major drawdowns since 2008:

YearMax Intrayear Drawdown (%)Context
2008-57%Global Financial Crisis
2009-28%Post-crisis volatility
2010-16%Flash Crash, Eurozone crisis
2011-19%US Debt Ceiling & S&P Downgrade
2018-20%Fed tightening, December crash
2020-34%COVID pandemic crash
2022-25%Fed hikes, inflation bear
2025-19.5%Post-2024 blowoff retrace

Outcomes:

  • 3 ended down: 2008, 2018, 2022
  • 3 ended up: 2009, 2010, 2020
  • 1 ended flat: 2011

And of course, none of those years featured a sitting US President personally driving market volatility, while simultaneously launching a full-scale trade war.

Now, after a 15%+ rebound from the early April lows, who would be shocked if Wall Street strategists are considering yet another narrative pivot.

That said, we rarely embrace histograms or “past history”, and we discount technical analysts who now want to reference “The Zweig Thrust” (which suggests ‘the technicals’ are pointing to a resurgence in a bullish set up) when visibility is so opaque. Said a different way, as expected, this earnings season is kicking off with a common theme from corporate CEOs and CFOs: “We are holding back guidance and not prepared to provide forward earnings projections simply because the compound effects of the Tariff War, coupled with less than optimistic economic outlooks with respect to a Tariff-induced Recession on the US Economy makes it impossible for us to forecast.” Not exactly inspiring.

Main Street Bulls Trounce Institutional Investors in April.

Notwithstanding an easy to grasp “less than sanguine setup”, according to data from Fidelity and Schwab, retail investors were either large net buyers of stocks throughout the April Showers, while hedge funds and other institutional managers were liquidating long positions. Now that April is proving to be an up month for stocks, and have bounced 15%+ from the Liberation Day lows, the notion that retail investors represent “dumb money” has once again been dispelled.

The fact is, the universe of retail investors has grown 10-fold in recent years, and their access to information, and their ability to decipher a range of data points is on par with nearly any or all of the geniuses working for Wall Street firms. More to the point, the ‘dumb money’ has been trained to deploy funds during ‘panic’ moments, and truth be told, that strategy has worked on a pretty consistent basis.

We don’t know. But it’s fun to observe the streams on X that have arm chair quarterbacks with crystal balls continue to tout and shout. Including a fellow by the name of David Hunter aka DaveHcontrarian who back in January 2023 had predicted a ‘market meltup that would take the $SPX from 4000 to 6000 before June!” Well, $SPX did reach $6000 24 months later (not 6 months later). And every week, since the beginning of 2025, including this week, Hunter insists “$SPX will surpass $7500 within months!” He adds that “once that rally meets my target (certainly before year-end), equity markets across the globe will suffer a 50%-60% crash.” Who doesn’t love financial porn?

Whether the ‘Buy-The-Dip’ philosophy has a shelf life of a more than a few weeks during the current cycle of uncertainty remains to be determined. Anyone who claims to be able to predict what might happen in three months, no less than 3 hours is in need of medication.

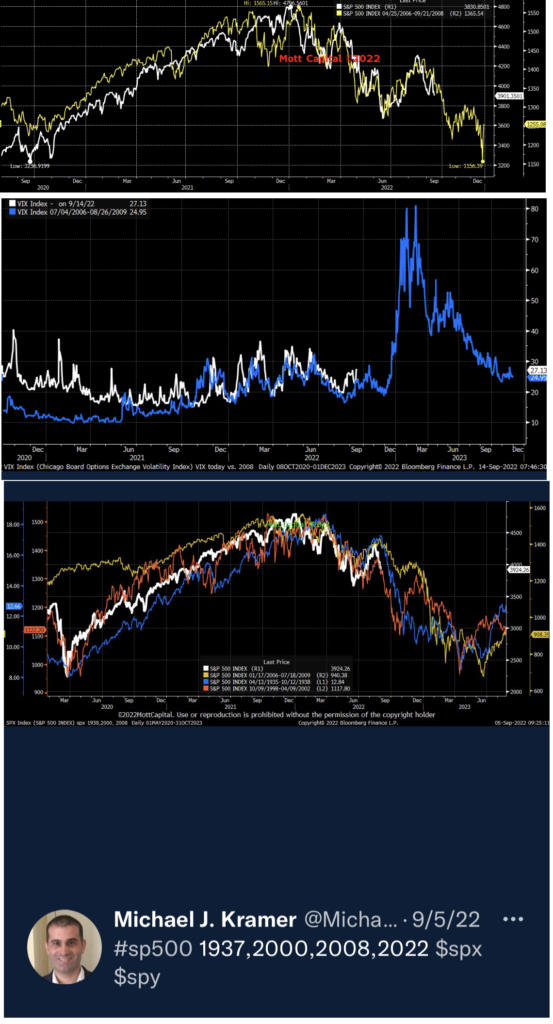
Instead, this outlet prefers to embrace insight offered by a select few un-conflicted folks (e.g. former JPM strategist Marko Kolanovic, Neil Azous of Rareview Capital, and FO manager Michael Kramer of Mott Capital who collectively have near-on 100 years experience and each combine macro analysis, true fundamental analysis and a sprinkling of technical indicators to form their short, medium and longer-term views.


Prescient or Piped into the President?

Thomas Peterffy, the 80-year-old billionaire founder of Interactive Brokers, is not just a long-time Trump supporter (vocally and financially); he’s also a fellow Mar-A-Lago member.

Peterffy, who built Timber Hill before launching IBKR, has made a number of prescient market calls over decades. In early April, while SPX was clawing its way off the mat, Peterffy hit the airwaves proclaiming:

“This is the greatest buying opportunity of my entire career!”

This came less than 24 hours before Trump’s surprise announcement — a 90-day pause on new tariffs (“Liberation Day”) — which ignited a 6% SPX rally over six sessions.

Coincidence?

Editor’s Note:
One of us has known Peterffy for over four decades and briefly served as a senior IBKR executive (and crafted their now-famous slogan). No accusation is made that Peterffy was tipped by anyone at Mar-A-Lago. We’ll also refrain from speculating whether Secretary of Commerce Howard Butt Lick might be more prone to… “monetizing information” obtained over Sunday brunch.

stock_forcaster-stock-market-pundits-2022-SPY-marketsmuse-warren-buffet

September Cycles & Stock Market Pundits

September (and October) are typically the most negative time periods for stock market investors, and to illustrate this seasonal pattern, this year is no different. And, stock market pundits are once again in the limelight.

First, if you are a CNBC enthusiast, stop reading here. Our MarketsMuse team has voted unanimously for you to cut the chord if your investment horizon is longer than 1-4 days. The stock market pundits on that program are, for the most part, day traders whose holding period on a particular trade is shorter than the days you would keep milk in your ice box.

(Editor Note: THEIR DEFINITION OF “INVESTMENT” IS BASED ON ANNUALIZED RETURNS; if they can make 1% -2% inside of two or three days, the odds are you won’t get the memo that they took their profits and ran! The odds are greater still that any of those folks who appear daily will admit that they took a loss two days after their ‘pick’ plummeted by more than 5%.)

Second, if you do follow financial news headlines, you might already appreciate that every major investment bank, whether it be JP Morgan, Goldman Sachs, Morgan Stanley or Bank of America, has its own pundits whose internal views are diametrically opposed to each other. Why would you be a “High Networth Client” of any of these firms, when they can’t even agree internally on how to advise you?! Good question.

In June of this year, and then again in July, JP Morgan’s 66- year old Chairman & CEO Jamie Dimon, who is no novice when it comes to financial market assessments, was vociferous in his view that equities markets were facing a pending hurricane. Yet the same day in June that Dimon became a front page ‘bomb thrower’, his very highly-paid Chief Market Strategist Marco Kolanovick advised JP Morgan clients to “buy the dip”, as the 46-year-old ‘genius’ predicted US stocks (as measured by S&P 500) “will likely rally and close the year unchanged”.

At Bank of America, Chairman and CEO Brian Moynihan (62 years old) has remained an ardent bull throughout the ups and bigger downs of 2022, while his Chief Market Strategist has been as grizzly as an angry bear since the beginning of the year. Goldman Sachs’s top guns have leaned toward the less-than-optimistic view for most of the year, following the lead of its Chairman David Solomon. Morgan Stanley CEO James Gorman has been been a bull for much of the year, and his Chief Market Strategist, Mike Wilson has been pounding the bear table, as he had been since early 2021.

All of this proves that broken clocks can be right at some point.

So, what is an investor (and or a CNBC ‘short-term trader’) to do, knowing that September-October time sell-offs are the best advertised “upcoming crisis events” since long before Millenials were even born?

MarketsMuse has been following an assortment of stock market pundits, ‘technicians’, and global macro experts for months. The stock market pundits have reliably proven to be wrong, simply because most of them are employed by asset managers and investment banks whose primary purpose of existence is to sell investment products to confused investors. The notion of advising clients to “stay in cash until there is more clarity” is the last thing they would advise, until after the stock market has rebounded 25% from its lowest point. And in bear markets, that is precisely the time to lighten up, not to enter.

The chartists have proven prescient (with bearish medium-to-long term views, and while various global macro gurus have been somewhat blind-sided thanks to “not anticipating extent of Russia-Ukraine fiasco to “discounting what the Fed meant and what they heard the Fed say”. The global macro pundits who take into technical analysis along with the assortment of pillars within the global macro playbook have, for the most part, been telling you to be wary of buying stocks since the Fed went into QT (Quantitative Tightening) mode.

Lesson to be learned: NEVER FIGHT THE FED; regardless of what Jim Cramer spews.

We can tell you that two of the more objective market experts that we’ve followed include Michael Kramer of Mott Capital and Neil Azous of Rareview Capital. Both of these 40-something students of financial markets have proven prescient throughout the year.

Kramer operates a relatively small hedge fund, yet is not beholden to bomb throwing and his humility factor is rare. While his equity-focused fund strategy is benchmarked to the S&P500 and that fund’s performance is still slightly negative on the year to date, his short-term trading calls have proven to be rock solid. Kramer is clearly a fan of all things technical, and his daily tweets and article posts on Seeking Alpha have made for great short and medium-term forecasts. Below are excerpts from charts that he has posted in recent weeks.

Rareview Capital’s Neil Azous layers his fundamental research (which incorporates rates, FX, energy, and geopolitical risk metrics) on top of technical charts. For example, in late April, after the S&P 500 had fallen from 4600 would to 4200, Azous sent a letter to a close-knit group of the world’s most sophisticated investors and warned of a fall down to 3600. Two weeks later, many (but not all) Wall Street analysts pivoted from bullish to bearish and bid on to Azous’s forecast. Azous then re-iterated his less than sanguine view in mid-May, suggesting S&P 500 (would likely go below 3400 before the worst was over).

Throughout the year, Bridgewater Capital’s Ray Dalio, viewed as one of a unique breed of global macro thought-leaders) has been an outspoken bear, even if it took him until recently to ballast his firm’s exposure to Chinese equities. While Wall Street stock market pundits have been pushing the buy the dip strategy, Dalio’s Bridgewater has reported 30% gains on investments. He’s still a bear; Dalio suspects the next 10 years will fall into the category of “another lost decade”.

From a historical perspective (yes, Matilda, history does it repeat itself!), and taking into account 2022 stock investors have suffered their worst start to a year since 1970, consider the following factoids that we sourced from across the ethernet:

  • According to APNews, bear markets since World War II have taken an average of 13 months to go from peak to trough, whereas the average time for the stock market to recover stands at 27 month
  • Forbes 08-24-22*  “In fact, the average length of a bear market for the S&P 500 is just 289 days. That’s not a typo. Just over 9 months and the average bear market is done. Finished. Not only that, but once the market turns around, the average bull market runs for 991 days or 2.7 years. Not a bad deal for investors. The bear market in the S&P 500 was confirmed on June 13th, 2022, but the market began its slide on January 3rd 2022. With this date as the start of the current official bear market, the average bear market of 289 days means that it would finish on the 19th of October 2022.
  • So there you go, the bear market will end, based on the historical average, in the Fall and the good times will be back by Christmas. * https://www.forbes.com/sites/qai/2022/08/24/the-average-bear-market-lasts-289-days-how-long-do-we-have-left/?sh=66f6e5245d5d
  • Raymond James’ historical performance of the S&P 500 Index throughout from `1926 through March 2017. The average Bear Market period lasted 1.4 years with an average cumulative loss of -41%.
  • Felix Richter / Statista.com June 2022  https://www.statista.com/chart/27616/length-and-depth-of-the-latest-s-p-500-bear-markets/bear Bear markets are not an everyday occurrence, thankfully, with the latest one being just the fourth in the 21st century. Looking at past bear markets all the way back to the 1970s indicates that things could very well get worse before they get better. In the previous seven bear markets, the S&P 500 dropped by an average of 38 percent before turning around and it often took years before the index had recovered all of its losses and returned to its previous peak.
  • Across the 10 bear markets since 1950, the longest was 929 days and the shortest was 33 days. Since 2000, there have been only three bear markets not including this one. One of those was history’s shortest; Bear markets, even the long ones, have always given way to bull markets
  • 1973-1974  48% decline, 69 months to break even..
  • 1980- 20 months; then 3 months to break even
  • 2008- 50% decline and two years to break even
  • S&P 500 bear markets since 1946 have taken an average of 389 calendar days to bottom, and then another two years to return to their prior high.
  • We are currently experiencing the 22nd bear market since 1929
  • The average loss of bear markets to reach the bottom before turning back up since 1929;  37%, Median 33.5%
  • The average length of a bear market is 344 days, median of 240 days (best case 2 years, outside 3 years)
  • 1990 bear market lasted 31 months
  • Nine of the 12 bear markets since 1948 have been accompanied by recessions, according to investment research firm CFRA
  • From peak Dec 1972, it took 8 years and 8 months  (to July 1980) for SP500 to achieve break even. Then it rallied 25% over the next 2 years, then fell 30% over the following two years into Aug 1983; not returning to a high point until January 1985
  • 2000-2007 was the lost decade.  Let’s not forget 2008-2013; prices peaked in late 2007, and did not achieve ‘break even’ until April 2013… Slightly higher (before adjusting for inflation) vs SP high of 2000.  So that’s actually a lost decade and ½.
  • According to investment analysis firm Seeking Alpha, the average duration of an S&P 500 bear market since the 1920s has been 289 days or about nine and half months. (The shortest, in March 2020, during the onset of the COVID-19 pandemic in the US, lasted just one month.) On average, the S&P 500 declined about 36% during those bear periods. 
  • But more recently, the 14 bear markets since World War II have averaged 359 days, or close to a year, according to Bespoke Investment Group.
  • Analyzing all the bear markets since World War II, Ben Carlson of Ritholtz Wealth Management found it took 12 months to go from “peak to trough,” or from the end of a period of growth to hitting rock bottom. That means the current bear market would bottom out at the beginning of 2023, a year after January’s peak.
  • Jan 2022, famed chartist Larry Williams predicted a series of declines and rallies, yet argued S&P500 would close the year higher. Yikes.
  • One of the shortest bear markets: Feb 2020 to Aug 2020, it took only 9 months to break even (more precisely, the shortest bear market in recent history Jan 2020 to Oct 2020 (pandemic era, the QE era with near-zero interest rates)
  • 2016 A recent study from Oxford University found that “returns on stocks with the most optimistic analyst long-term earnings growth forecasts are substantially lower than those for stocks with the most pessimistic forecasts.” In other words, your investment portfolio would be better off if you did the exact opposite of what most Wall Street analysts advise.

If you have a comment, a contribution or a tip, please reach out to us