(Bloomberg) — A European stock trade that deployed the use of ETF products as a means of hedging currency exposure is one that enamored global investors throughout 2015 and drew more money than practically anything else in equities is blowing up in people’s faces.
As the moves in the the WisdomTree Europe Hedged Equity Fund (NYSE:HEDJ) show, the strategy of going long the region’s shares while hedging to mute the euro’s swings is unraveling. The exchange- traded fund has plunged a record 14 percent in December, erasing annual gains that swelled to as much as 23 percent in April and were still above 18 percent in July. Hit by withdrawals, its market value has fallen to $17 billion from more than $22 billion as recently as August.
Investors are pulling money from the fund like never before after Mario Draghi’s increase in European Central Bank stimulus failed to live up to expectations, triggering a decline in the region’s stocks and a strengthening of its currency.
“A lot of investors have been protecting themselves against a weaker euro, aiming for European equity returns which have been very strong this year as long as you hedged the euro,” said Ewout van Schaick, head of multi-asset portfolios at NN Investment Partners in The Hague. His firm oversees 180 billion euros ($198 billion). “That story seems to be over after the recent central bank actions. Investors are positive on European equities but are less sure it has to be on a hedged basis.”
The fund’s popularity grew earlier this year, when its hedge became of paramount importance as the ECB started its bond-buying program, triggering a weakening of the euro to levels not seen since 2003 and a 22 percent surge in the region’s stocks. In the first four months of the year, traders poured $13 billion in the ETF, making it the favorite vehicle to bet on European equities.
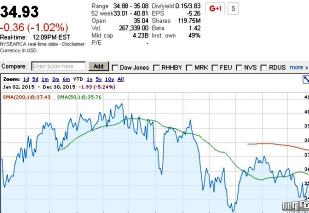
FEZ Fizzles. Fast forward to December, and things don’t look as good. The Euro Stoxx 50 Index, whose ETF tracker is NYSE:FEZ is down 7.1 percent through yesterday’s close, heading for its worst ending to a year since 2002, while the euro is set for its biggest monthly advance since April against the dollar.
Forecasters don’t see the currency moving much from now. It’ll weaken to $1.05 and stay at that level for the first three quarters of next year, before starting to rebound, according to projections. It’s hovered around $1.09 for most of December.
That doesn’t mean the consensus is turning bearish on European equities. Even without a significant weakening of the currency, strategists expect euro-area equities to climb another 12 percent by the end of next year, aided by a recovering economy, ECB stimulus and low valuations. The Euro Stoxx 50 rose 1.2 percent at 11:47 a.m. in London. At 14.2 times estimated earnings, companies on the gauge are cheaper than those on the Standard & Poor’s 500 Index or MSCI All-Country World Index.
“We still believe in European equities,” Van Schaick said. “The European economic recovery is in the earlier stage, so all the lights are green for Europe. They’re going to do a lot better than U.S. equities next year.”