Most sophisticated investors, whether Tier 1 institutional investment managers, ‘top minds’ across the sell-side, or the truly savvy, self-directed types should all agree that fixed income market signals, and investment grade credit spreads in particular are a prelude to what equities market can expect to happen.
Whether the ‘lag time’ is 3 months, 6 months or 9 months, history has proven that interest rate markets and investment credit spreads are a reliable indicator. Reading those ‘tea leaves’ is complex, and a task often relegated to “senior research analysts.” That said, MarketsMuse followers (primarily investment industry professionals who hail from both sides of the aisle) know that when it comes to truly superior research within the financial market ecosystem, finding diamonds in the rough is not easy, particularly when the landscape is a minefield of jibber jabber produced by ‘experts’ at top banks–folks whose interests are more often aligned with their own wallets as opposed to being aligned with their clients’ best interests.
Worse still, having access to understandable, plain-speak analysis from objective and un-conflicted (aka INDEPENDENT) research is a challenge, albeit the unbundling movement is helping to address that issue. Without further ado, the MarketsMuse Fixed Income team is happy to share an ‘evergreen’ piece from one such highly-trained and completely conflict-free expert. You’ve seen the work from Neil Azous of Rareview Macro LLC here before and the banner of his publication “Sight Beyond Sight” speaks volumes.
Roll the tape….
A segment from our daily global macro newsletter, Sight Beyond Sight, written at the end of July – What Investment Grade Credit is Really Telling Us – made the cover of the back-to-school issue of the IRP Journal, a recently launched magazine that is digitally distributed to institutional investors and features current research from independent research providers (aka IRP’s). As our readership expands deeper into Asia we are pleased to have been selected to be on the cover by this Hong Kong-based publisher.
In the past few days, US investment grade (IG) credit spreads have reached new three year wides. Historically, the absolute level of these spreads is consistent with periods of economic and financial market stress. Additionally, the daily volatility of these spreads has increased dramatically in recent weeks.
Below is a chart of the Moody’s Baa Corporate Bond yield spread over the US 30-year Treasury yield.
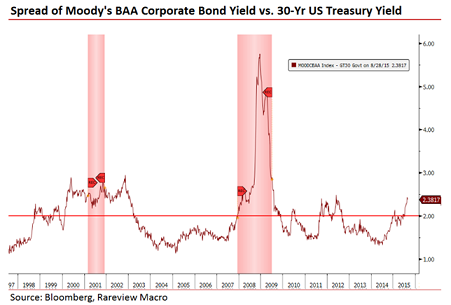
What is the significance of this observation?
Investment grade corporate bonds are one of the least risky investments within the capital structure, and less sensitive to changes in default risk due to economic weakness. Moreover, the credit market is arguably, next to the slope of the yield curve, the greatest predictor of future economic stress.
The most widely cited explanation for the recent widening in spreads is that it is due to the amount of new investment grade credit issuance. Indeed, that is one factor as new issuance (+SSA) set a record pace yesterday after having surpassed $1 trillion, a level not reached last year until mid-September.
However, the recent widening of the spreads is not just down to the recent surge in corporate issuance. Issuance is simply not a large enough driving force to cause this level of “stress”. The reasons for this widening are two-fold.
Firstly, the aggregate level of issuance, to a degree, is beginning to finally catch up with the market after years of sensational appetite. Corporations, in aggregate, are raising their leverage levels by issuing the new debt and not using the proceeds to grow their revenues or cash flows to compensate. Put another way, the market is beginning to segregate between issuance related to refinancing a company’s “credit stack” as part of its normal annualized funding requirements and pure capital redeployment for the benefit investors.
By the way, not only is the IG spread widening, signaling the distinction noted above, but the equity markets are now doing so as well. See the below chart of the ratio of the S&P 500 to the S&P 500 BUYUP index overlaid with the US Treasury 5-30yr yield curve. Stock buy-backs are simply underperforming in 2015 after multiple years of out-performance as the yield curve steepens in anticipation that interest rate hikes will slow the capital redeployment process down. As a reminder, it is much easier to slow a buy-back than reduce a dividend as the former has a time-band and discretion to implement and the latter generally is a board-level decision.