Tag Archives: spy

New High For $SPY Despite Mixed Market Signals; Corps Issue $20 Bil In Debt So Far This Week..and, its Only Tuesday !

MischlerLogo Nov 2012Refreshing Market Commentary courtesy of Ron Quigley, Mgn.Dir./Head of U.S. Syndicate Desk & Primary Sales for Mischler Financial Group.

With Washington in full-out gridlock, Americans should be turning to the best national news, namely corporate profits.  Corporations are driving the resurgence in equity markets posting overall fabulous earnings.  The flight to under-owned equities has also helped the DOW reach what today represented a new all-time high when it screamed past the previous record high of 14,164 set back on October 9, 2007 at the open.  The DOW closed today’s session at 14,253 or 89 points above its previous record.  The S&P meanwhile, is closing in on its all-time high of 1,565 also set on October 9, 2007, sitting a mere 26 points away ending the session at 1,539.

Today’s pair of economic data releases conveyed a mix message about the shape of the U.S.A.  On one hand, the Institute for Supply Management’s (ISM) Non-Manufacturing Business Survey painted a bright picture indicating that segment of the nation’s economic activity grew for the 38th consecutive month.  It was the highest such reading since the 56.1 registered in February of 2012.  Construction is showing some signs of improvement as are financial and insurance companies among others.  However, in the push-me/pull-you that characterizes much of the data we see, today’s Economic Optimism Index dipped by 5.1 points versus the prior while remaining over 5 points behind its annual average.  Readings above 50 point to optimism, below it – pessimism.  The Index is comprised of three component parts namely, a six-month economic outlook, a personal financial outlook and confidence in federal economic policies.  All three categories posted declines. This month 60% of respondents indicate they believe the economy is in a recession.

So there it is…..more contradictory information to make our day a little brighter.  Heck, my barometer of optimism is if I get all my work done in one day, can start from a clean slate the next and read a bed-time story to my six year-old daughter well then, things are looking good.

On another note, Hugo Chavez is dead and you all know what that means……..you can now go ahead and buy gas at your local Citgo station.  Pleasant driving people!

Here a re-cap of today’s economic data releases: Continue reading

Collaring Multiple-Asset ETFs to Manage Tail Risk

Courtesy of Phil Gocke, Options Industry Council

Since the 2008-09 financial crisis and the central bank’s response of near zero interest rates, financial markets have been vacillating violently between risk-on and risk-off periods. This bipolar attitude toward risk has increased asset class correlations, negating the effective benefit of many traditional equity diversifiers. In this unpredictable climate, investors are focused on seeking strategies that offer downside protection but also upside participation.

One solution to achieving both of these often mutually exclusive desires is an option-based equity collar. A long collar strategy involves owning the underlying, while being long a put option with a strike price below the market and short a call option with a strike price above the market. This orientation of the strike prices makes each put and call option out-of-the-money (OTM). An option collar can provide portfolios with greater downside risk protection than standard multi-asset diversification programs, but they also allow for profits during risk-on rallies.

Recent research has examined the performance of the collar strategy against a range of exchange-traded funds (ETFs) across multiple asset classes, including equity, currency, commodity, fixed income and real estate. The resulting book, “Option-Based Risk Management in a Multi-Asset World,” was authored by Research Analyst Edward Szado and University of Massachusetts Isenberg School of Management Professor of Finance Thomas Schneeweis. Their analysis shows that for most of the asset classes considered, an option-based collar strategy, using six-month put purchases and consecutive one-month call writes, provides a holy grail of investing of improved risk-adjusted performance and significant risk reduction.

“Collar growth” (below) illustrates the benefit of an equity collar strategy on the popular SPDR S&P 500 (SPY) ETF. Over the 55-month study period ending Dec. 30, 2011, the 2% OTM passive SPY collar returned more than 22% (4.5% annually), while the long SPY experienced a loss of more than 9% (–2.1% annually). The collar earns its superior returns with less than half the risk as measured by the standard deviation (8.4% for the collar vs. 19.5% for SPY).

One of the most telling statistics supporting the potential benefit of equity collar protection is the maximum drawdown. During the study period, SPY experienced a maximum loss of 50.8% while the 2% OTM collar reduced this negative performance by four-fifths to a maximum loss of 11.1%. Continue reading

June ETF Short Report: ‘Q’s’ Shorts Drop 42%

Courtesy of Olly Ludwig

Short-sellers last month significantly cut their bets against an array of the broadest U.S. stock indexes, which looks quite sensible in the rearview mirror considering both the S&P 500 and the Dow Jones industrials average rallied by nearly 4 percent in June.

While financial markets are again on tenterhooks over the dismal fiscal situation in Europe—and Spain’s in particular—last month marked something of a respite from the three-year-old eurozone debt crisis, as short interest on non-U.S. stocks fell as well.

Most conspicuously, the number of shares short on the PowerShares QQQ Trust (NasdaqGM: QQQ), the Nasdaq 100 ETF, dropped 42.6 percent in June, compared with a nearly 9 percent rise in the prior month. The decline left short interest on the “Q’s” at 10 percent of the ETF’s outstanding long float, compared with more than 18 percent at the end of May, according to data compiled by IndexUniverse.

Shorts on the SPDR S&P 500 ETF (NYSEArca: SPY) meanwhile fell by almost 23 percent in June, compared to a 13 percent jump in May. Also, short interest on the iShares Russell 2000 Index Fund (NYSEArca: IWM) fell by more than 7 percent last month, after holding about steady in the prior month.

Dark Clouds Ahead? Continue reading

Covered Call Portfolios-Lower Volatility, Better Performance

For those not aware, the bloom is off the rose right now as equity markets are on track to record the biggest string of down days in a long time.  With the media distracting every investor re: FB’s IPO, the fact is, equities markets in general are confounding long-only fund managers.

The good news is that a growing number of institutional fund managers, and L/S hedge fund managers are going back to basics and revisiting the use of writing calls against positions that don’t necessarily move in a straight-up line.

The chart below is a good teaser illustrating the performance of select ETF covered writing performances, and a good lead in for the Seeking Alpha article that does a good job of framing the covered writing ‘argument’ for any fund manager that doesn’t use options in the course of their fiduciary obligation to minimize volatility and enhance alpha


Covered Calls Vs. Selling Puts On The SPY

Courtesy of Seeking Alpha’s “Reel Ken”

We often hear about selling covered calls to generate additional income. We also hear about selling Puts to generate income. So the question becomes: Which is a better strategy?

The first step in answering this question is to understand that, from a performance perspective, they are two sides of the same coin. That is, if you owned, say 100 shares of the SPDR S&P 500 ETF (SPY) and sold a covered call with a strike of, say $140, in theory you would get a similar result by simply selling a put option with a strike of $140. Reality is a little different.

Let’s look at why this is so. SPY is currently trading at $139.79. The January 2013 $140 strike call sells for $7.99. If SPY closed at or above $140, I would make 21 cents on SPY and $7.99 on the covered call for a total of $8.20. However, SPY pays a quarterly dividend averaging about 66 cents, and the SPY shares would earn this dividend. There are three dividend events (June, September and December) totaling $1.97. So my total return would be $10.17 ($7.99 + $0.21 + $1.97).

In contrast, the $140 strike put sells for a credit of $10.15. If SPY closes at or above $140, this total credit is earned profit and compares favorably to the $10.17 combined return from the covered call. So, the covered call and sold put are about equal.

If SPY closed below $140, the equivalence stays intact, but I’ll leave it to the reader to do the math.

What about other option expiration dates? Continue reading

Indexing Beats Hedge Fund Investing

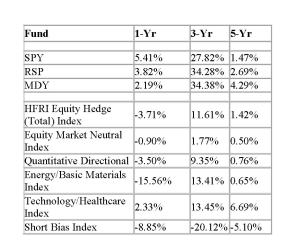
A brief, but intriguing blog post over at SeekingAlpha–written a a self-proclaimed gear-head backed by compelling research suggests that returns using straight-forward indexing has trumped fast-money hedge fund investing for each of the past five years.

As illustrated by the table below (the full article can be accessed by clicking the image), blogger/private investor Jeff Gonion reached a pretty foregone conclusion when stating, “Overall, investors in equity-based hedge funds fared worse than investors that simply invested in index funds. Looking across the entire universe of hedge funds, the results are similar for non-equity focused hedge funds. The bottom-line is that most hedge funds don’t beat the market, especially after fees.”

We happily encourage any/all hedge fund managers to come forward (in full frontal or without fanfare i.e. anonymously, to rebut or to simply qualify the take-away. We could insert lots of caveats, but we’ll defer to an HF to defend itself.


Betting on Benchmarks : MDY + IJR Out-Performs SPY

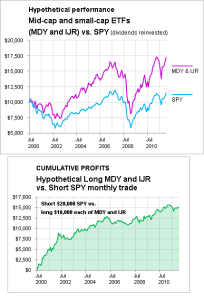
Private investor and SeekingAlpha contributor Richard Bloch makes a noteworthy observation when suggesting that “MDY + IJR > SPY”. Bloch’s thesis is that investing in the S&P 1500, but without the top 500 would have produced noticeably better returns.

In fact, Bloch’s analysis includes not only a 10-yr look-back on comparing a $5000 investment in both MDY and IJR vs a $10,000 investment in SPY, but the cumulative profits if each month one would have shorted the same notional dollar of SPY against the combined notional long positions in MDY and IJR (accounting for both long dividends paid and short dividends owed). Click on the image for the full commentary: