Tag Archives: oil

GlobalMacro Rare View: Fixed Income Market Flashing Recession Alert?

MarketsMuse Global Macro and Fixed Income desks converge to share extract from 23 July edition of Rareview Macro commentary via its newsletter “Sight Beyond Sight”. For those not following the corporate bond market, most experts will tell you the equities markets follow the bond market–which in turn is a historical indicator when it comes to economic expansion, contraction, and recession. Below is courtesy of Rareview’s founder/managing member Neil Azous .

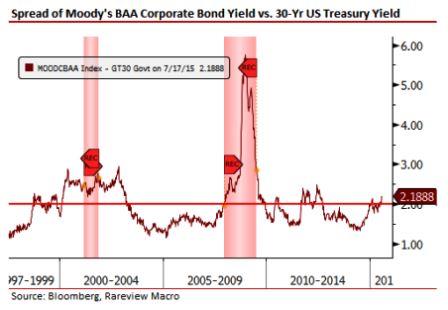
In the past few days, US investment grade (IG) credit spreads have reached new three year wides. Historically, the absolute level of these spreads is consistent with periods of economic and financial market stress. Additionally, the daily volatility of these spreads has increased dramatically in recent weeks.

Below is a chart of the Moody’s Baa Corporate Bond yield spread over the US 30-year Treasury yield.

What is the significance of this observation?

Investment grade corporate bonds are one of the least risky investments within the capital structure, and less sensitive to changes in default risk due to economic weakness. Moreover, the credit market is arguably, next to the slope of the yield curve, the greatest predictor of future economic stress.

The most widely cited explanation for the recent widening in spreads is that it is due to the amount of new investment grade credit issuance. Indeed, that is one factor as new issuance (+SSA) set a record pace yesterday after having surpassed $1 trillion, a level not reached last year until mid-September.

However, the recent widening of the spreads is not just down to the recent surge in corporate issuance. Issuance is simply not a large enough driving force to cause this level of “stress”. The reasons for this widening are two-fold.

Firstly, the aggregate level of issuance, to a degree, is beginning to finally catch up with the market after years of sensational appetite. Corporations, in aggregate, are raising their leverage levels by issuing the new debt and not using the proceeds to grow their revenues or cash flows to compensate. Put another way, the market is beginning to segregate between issuance related to refinancing a company’s “credit stack” as part of its normal annualized funding requirements and pure capital redeployment for the benefit investors.

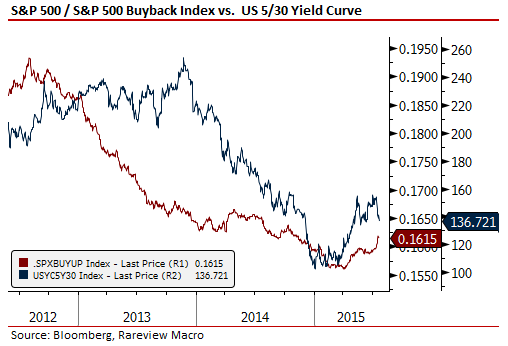
By the way, as we have pointed out in these pages for a while now, not only is the IG spread widening, signaling the distinction noted above, but the equity markets are now doing so as well. Again, see the below chart of the ratio of the S&P 500 to the S&P 500 BUYUP index overlaid with the US Treasury 5-30yr yield curve. Stock buy-backs are simply underperforming in 2015 after multiple years of outperformance as the yield curve steepens in anticipation that interest rate hikes will slow the capital redeployment process down. As a reminder, it is much easier to slow a buy-back than reduce a dividend as the former has a time-band and discretion to implement and the latter generally is a board-level decision.

Secondly, we are aware that discussions around the lack of liquidity in the credit markets are a near daily occurrence these days. The only observation of note is that there is now a new term associated with the market construct – that is, “liquidity cost basis”. In simple terms, due to the lack of market depth and the continued sensational appetite to issue bonds, there is now a higher premium being applied in the market to finding liquidity if you want to own a bond. All we are saying is that the investor concerns over liquidity are not only being priced into the market but those worries have been crystalized with a fancy Wall Street name.


The end result is that investors are demanding a higher premium for the new issues they are taking down, largely due to deteriorating fundamentals in the actual credit.


Now, the second most widely cited explanation for the spread widening is that it is due to the energy sector. If you decompose the spreads it is easier to argue that a notable portion of the weakness is due to the deterioration in the energy sector, whose credit spreads are highly correlated with the lower price of crude oil. However, energy makes up a much smaller portion of the investment grade market (~12%)  than it does for the high yield (i.e. ~18%+), which indicates that the breadth of weakness stretches across many other sectors of the investment grade market and is not due to one single risk factor, such as crude oil.

Lastly, we would note that the absolute levels of these spreads referenced on the chart above are also consistent with weakness after the US quantitative easing program was completed and in anticipation of an interest rate hike. We are not sure how much of the spread widening is a result of this less easy monetary policy but the fact is that both QE and the zero interest rate policy forced investors to perpetually search for yield and investment grade credit was a major source of that appetite. To what degree that happened is difficult to handicap but some of those inflows have to reverse given how asymmetric the outcome would be if the Federal Reserve actually embarked on a rate hiking cycle consistent with past cycles, as opposed to a gradual pace of hikes.

Taking a step back, if you look at both the US yield curve and the credit markets, what you find is that both are saying roughly the same thing – that is, there is currently a recession risk embedded in the market, and that there is the potential for the end of this credit and/or economic cycle to be on the horizon.

Take what we have just sketched out any way you want. We are not making a bearish call on risk assets or attempting to sell blood. All we are doing is saying that credit markets, the yield curve and corporate share repurchase trends are signaling some concern sometime over the next 6-9 months. Given that we have not had a recession in 6-7 years, and historically we have had one every four years on average in the modern era, it is not at all unreasonable to start to watch these signals a lot more closely from now on for something more acute.

Above segment from investment newsletter Sight Beyond Sight is re-published with permission from global macro think tank Rareview Macro LLC. Subscription to the daily commentary and trade strategy profiles is available via the firm’s website


Turm- Oil: Black Gold Turns to More than 50 Shades of Gray for High Yield Bond ETFs

MarketsMuse update on the downtick in oil prices and impact on high yield bond ETFs, including energy-sectory junk bonds includes extract from Institutional Investor Jan 7 coverage by Andrew Barber.

MarketsMuse editor note: The recent implosion of crude oil prices has triggered a conundrum for almost every investment analyst who prides themself on pontificating the domino effect impact on the broad universe of market sectors and asset classes. Much has been said about the how, when and where the trickle-down effect of the lower oil prices will effect corporate balance sheets, and in particular, those with a boatload of outstanding debt.  For high-grade corporate debt issuers, some believe lower energy costs bode will. For high yield bond issuers (companies that typically include energy industry players), the jury remains out for the most part. Experts that MarketsMuse has spoken with believe that if US drillers and frakers cut back on operations and reduce overhead quickly, it will help stem the burn that inevitably results from manufacturing a product that costs almost as much (if not more) to make as it what customers pay for it. Then again, as the supply begins to wane consequent to production cutbacks, market forces will, in theory, cause prices to rise..and those companies will be back in the black before having to sweat too much about interest payments on outstanding debt.

II logo


II’s coverage on the topic is framed nicely via this extract:

mcormond jan15 The impact of rising yield for energy producers on high yield markets has also spilled over into the exchange-traded funds and closed-end funds. “ETFs create a simple wrapper for investors to modify easily their exposure to high yield fixed income markets” says Andy McOrmond, managing director at WallachBeth Capital, a New York-based institutional brokerage that focuses on ETF and portfolio trading. Mohit Bajaj, director of ETF trading solutions, also at WallachBeth, notes that despite the volatility injected into the market for high-yield exchanged-traded products during the recent oil sell-off, short interest has remained relatively stable and borrows have been easily obtainable. Bajaj attritubes this stability to a maturing institutional appreciation of exchange-traded fund products.


For the full article from II, please click here


Finally! Now You Know How to Play the Oil ETFs

MarketMuse update courtesy of ValueWalk.

It’s the first (real) week back from holiday break, but the story is the same as it was before Christmas, and before Thanksgiving for that matter…. Crude Oil continues to fall like a lead oil filled balloon, falling below the $50 mark on Monday for the first time since 2009. It’s even gotten to the point of family and friends asking where we think Crude Oil will bottom at parties and dinners, getting our contrarian antennas perked up.

The million, or actually Trillion, dollar question is where will Crude finally find a bottom and bounce back? Fortune let us know recently that the $55 drop in Brent Oil prices represents about a Trillion dollars in annual savings.

Now, while some are no doubt betting on continued downside with the recent belles of the ball – the inverse oil ETFs and ETNs ($DTO) ($SCO) ($DWTI), the last of which is up a smooth 527% since July {past performance is not necessarily indicative of future results}. Others are no doubt positioning for the inevitable rebound in energy prices, thinking it is just a matter of when, not if. Crude Oil is back around $70 to $100 a barrel. And what a trade that would be. Consider a move back to just $75 a barrel, the very low end of where Crude spent the last 5 years, would be a 50% return from the current $50 level. It seems like that could happen nearly overnight without anyone really thinking much about it.

So how do you play a bounce in Oil?

Well, the most popular play, by size and volume ($1.2 Billion in Assets, $387 million changing hands daily), is no doubt the Oil ETF (USO). But is that really the best way to ‘play’ a bounce?

Consider that USO Is designed to track the “daily” movement of oil. What’s the matter with that? One would hope that the ETF closely matches the daily move of Oil, right? Well, yes and no. Yes if you are going to buy the ETF for one day, or even a couple of days; no if your investment thesis is oil prices will climb higher over an extended period of time. Because, and here’s where it gets tricky – USO’s long term price appreciation won’t match the sum of its daily price appreciations. How is that possible?

You see, the ETF works by buying futures contracts on Oil, and there are 12 different contracts in Crude Oil futures each year, you guessed it – one for every month. And while the so called ‘front month contract’ is trading near the number you see on the news every night ($50 yesterday), the further out contracts, such as 10 to 12 months from now, may already reflect the idea that Oil prices will be higher.

Indeed, the price for the December 2015 contract is $57, versus $50 for the front month. So there’s $7, or a 14% gain, already “built in” to the futures price. What’s that mean for the ETF investor? Well, if you are correct that Oil will rebound, and it does so, to the tune of rising 14%, or $7 per barrel, over the next 11 months; the ETF likely won’t appreciate 14% as well. It likely won’t move at all, because it will have to sell out of its expiring futures positions and buy new futures positions each month. This means it will essentially have to “pay” that $7 in what’s called “roll costs”.

This is why $USO has drastically underperformed the “spot price” of Oil over the past five years, with $USO having lost -39% while the spot price of Oil went UP 48%. It is like an option or insurance premium – a declining asset with all else held equal. Just look at what happened during the last big rally for energy prices between January 2009 and May 2011. That’s a 110% difference between what you thought was going to happen and what the ETF rewarded you with.

For the full article from ValueWalk, click here.


Crude Oil-The Russian Calculus; Deciphering The Macro-Strategy Tea Leaves

Below commentary is courtesy of Oct 8 a.m. notes from macro-strategy think tank Rareview Macro LLC’s “Sight Beyond Sight” and is provided as a courtesy to MarketsMuse readers who embrace smart insight.  For those with interest in or exposure to the assortment of globally-focused ETFs across asset classes, we think you’ll welcome this content…If subscribing to newsletters from leading experts is not your ‘bag’ (regardless of how fairly-priced Rareview’s is), you should want to follow Rareview Macro’s twitter feed

Growth Scare Expanding Now…Large Cap Equity Indices Most at Risk
• Russia Enters the Vice-Grip
• EU Growth Profile: Cross-Asset Correlation to Reconnect & Lead EURO STOXX 50 Index Lower
• US Growth Profile: Pillars of Housing, Autos & Texas to Lead S&P 500 Index Lower
• China: H and A Share Markets Continue to Diverge…A Share Market is Correct
• Model Portfolio Update: Taking Profit or Restructuring Brazil (EWZ) Equity Position

Overnight

Right now everyone has a favorite metric that points to further disinflation. But, at the end of the day, the real world only really cares about one – Crude Oil.

Brent Crude Oil has made another new low and WTI Crude Oil has taken out the January low.

We are highlighting this first today for a number of reasons. Continue reading

UK’s Abydos Hedge Fund Using Options to Prepare for Iran Strike

(Reuters) – Abydos Capital, a new hedge fund run by a former partner at one of London’s most high-profile oil investors, is worried about a potential military strike against Iran and plans to use options to protect his portfolio.

Jean-Louis Le Mee, Chief Investment Officer of Abydos, told Reuters he thinks there is a 25 to 50 percent chance of an Israeli strike against Iran’s nuclear capabilities, an act that would likely send stock markets tumbling and drive up oil prices, hitting hedge funds that hadn’t protected their portfolios.

Le Mee, one of the first hedge fund managers to discuss such a strategy, said he was planning to use options to profit from a spike in oil prices and a fall in equities via the S&P 500 index .SPX if Iran was attacked over its nuclear programme.

“There’s a high chance that something will happen either this summer in June/July or after the U.S. elections,” said Le Mee, whose former firm BlueGold made headlines in 2008 by calling the peak of the market. “If talks break down, then the Israelis could do something very quickly.

A typical hedging policy could see a fund buy call options, the right to buy at a certain price, on an asset it expects to rise, and buy put options, the right to sell at a predetermined price, on assets it expects to fall. Continue reading