Tag Archives: INAV

bond etf liquidity

Calling for Clarity: Corporate Bond ETF Liquidity

There continues to be a call for clarity with regard to the topic of corporate bond ETF liquidity and where/how corporate bond ETFs add or detract within the context of investors ability to get ‘best execution’ when secondary market trade in underlying corporate bonds is increasingly ‘illiquid.’

This not only a big agenda item for the SEC to wrap their arms around, it is a challenge for “market experts” to frame in a manner that resonates with even the most knowledgeable bond market players.

MarketsMuse curators noticed that ETF market guru Dave Nadig penned a piece for ETF.com last night “How Illiquid are Bond ETFs, Really?” that helps to distill the discussion elements in a manner that even regulators can understand.. Without  further ado, below is the opening extract..

“Transcendent liquidity” is a somewhat silly-sounding phrase coined by the equally silly Matt Hougan, CEO of ETF.com, to discuss the odd situation in fixed-income ETFs—specifically, fixed-income ETFs tracking narrow corners of the market like high-yield bonds.

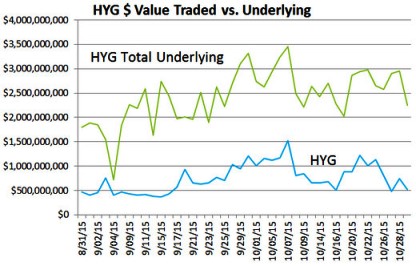
But it’s increasingly the focus of regulators and skeptical investors like Carl Icahn. Simply put: Flagship funds like the iShares iBoxx High Yield Corporate Bond ETF (HYG | B-68) trade like water, while their underlying holdings don’t. Is this a real problem, or a unicorn?

Defining Liquidity

The problem with even analyzing this question starts with definitions. When most people talk about ETF liquidity, they’re actually conflating two different things: tradability and fairness.

Tradability is actually a pretty simple concept: How well will the market let me get in or out of an ETF? And for narrow fixed-income ETFs (I’m limiting myself to corporates, in this analysis), most investors should be paying attention to the fairly obvious metrics, e.g., things like median daily dollar volume and time-weighted average spreads. By these metrics, a fund like HYG looks like the easiest thing to trade ever:

On a value basis, the average spread for HYG on a bad day of the past year is under 2 basis points. It’s consistently a penny wide on a handle around $80, with nearly $1 billion changing hands on most days. That puts it among the most liquid securities in the world. And that easy liquidity is precisely what has the SEC—and some investors—concerned.

Fairness

But that’s tradability, not fairness. Fairness is a unique concept to ETF trading. We don’t talk about whether the execution you got in Apple was “fair.” You might get a poor execution, or you might sell on a dip, but there’s no question that your properly settled trade in Apple is “fair.”

In an ETF, however, there is an inherent “fair” price—the net asset value of the ETF at the time you trade it—intraday NAV or iNAV. If the ETF only holds Apple and Microsoft, that fair price is easy to calculate, and is in fact disseminated every 15 seconds by the exchange.

But when the underlying securities are illiquid for some reason (hard to value, time-zone disconnects or just obscure), assessing the “fair” price becomes difficult, if not impossible.

If the securities in the ETF are all listed in Tokyo, then your execution at noon in New York will necessarily not be exactly the NAV of the ETF, because none of those holdings is currently trading.

Premiums & Discounts

In the case of something like corporate bonds, the issue isn’t one of time zone, it’s one of market structure. Corporate bonds are an over-the-counter, dealer-based market. That means the iNAV of a fund like HYG is based not on the last trade for each bond it holds (which could literally be days old), but on a pricing services estimate of how much each bond is worth. That leads to the appearance of premiums or discounts that swing to +/- 1%.

To read the full article, please click here

ETF Volatility: The Real Story Behind The [Bloomberg] Story

indexuniverseCourtesy of Dave Nadig’s July 12 column

This morning Bloomberg published a story titled “ETF Simplicity Betrayed by Volatility in Market Selloff.”

In the article, the authors contend that they’ve run the numbers, and that ETFs are just flat-out more volatile than mutual funds. Here’s the lead:

“Share prices for the 10 largest diversified emerging-market ETFs on average were 42.6 percent more volatile than their underlying indexes from May 22 to June 24.”

Let’s break down what they could possibly mean here, and let’s start with a few baselines.

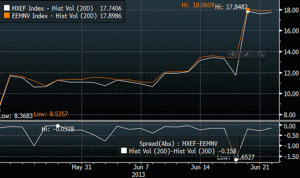
While the article claims it’s not addressing the issue of premiums and discounts—that is, how far off fair value a given ETF closes in market trading versus its underlying index—it’s fairly clear that’s not the case. If it were, then the following chart wouldn’t make sense.

This is a rolling look at the 20-day historical volatility of the iShares MSCI Emerging Markets ETF (NYSEArca: EEM) and the actual index it tracks, over the period in question. I’m looking here at the actual NAV, and as you’d expect, they track extremely closely:

1---EEM-VOL

The bottom line looks at the difference, and you might ask: “Well, why is there any difference at all?”

Continue reading

Bond ETFs 101: Understanding the Meaning of Liquidity, Arbitraging iNav

   Courtesy of Dave Nadigindexuniverse

MarketsMuse Editor Note: For those unfamiliar with the logistics of buying and selling corporate bonds in the secondary market,  and particularly for those not fluent in why/how corporate bond ETFs are priced and trade, the following column courtesy of IndexUniverse’s Dave Nadig provides a good primer. Important take-away: if an executing broker attributes a poor execution to “not enough liquidity”, we respectfully suggest that you are likely using the wrong broker.

Apparently the last week around here has been iNAV week. With Matt calling for their banishment, me agreeing with him (much to my dismay) and Ugo Egbunike calling us both idiots.

And Ugo’s points are all valid. INAV can be a fantastic tool, and one which smaller investors can use to make money. The action in this week’s bond market is a fantastic case in point.

Now, bond pricing is a tricky thing. As Rick Ferri pointed out today in an excellent blog over at Forbes, when the liquidity of the bond market starts getting shaky, bond ETFs can trade well below their fair value. He uses that fact as reason to suggest avoiding bond ETFs. I see it as a trading opportunity.

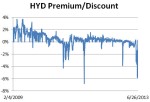
Let’s pick a simple example I’ve been following all week: the Market Vectors High Yield Municipal Bond ETF (NYSEArca: HYD).

I’m not a bond master; I won’t tell you whether this week was a good or bad time to buy high-yield munis. But what I can tell you is that as a rule, it more often trades at a premium than a discount:1PoorMansArb

For the entire article, please visit IU’s site by clicking here

Assessing the Merits of an ETF: Debunking Common Myths

Extract of white paper published by Chris Hempstead, Head of ETF Trade Execution for WallachBeth Capital LLC

With respect to analyzing and selecting ETFs, one of the most common and frustrating mistakes that I overhear is “..unless the fund has at least some minimum AUM ($50mm in many cases), or has average daily trading volume less than [some other arbitrary number] (say 250k shares) it should be avoided…”

Some other arguments against ETFs go so far as to suggest that “..ETFs need to have a certain history or track record before they should be considered…” Adding insult to injury is the claim that “investors are at risk of losing all their money if an ETF shuts down.”

In light of recent articles being picked up by media from New York to Seattle, I would like to dismiss a few of these common, yet unwarranted reasons to avoid an ETF based solely on AUM, ADV or track record.

 First, let’s address AUM:

“ETFs with less than $50mm should be avoided”

In order for an ETF to come to market (list on an exchange) the fund needs to have shares created. This process is often referred to as “seeding”. The ‘seeder’ is the initial investor who delivers into the custodial bank the assets required to back the initial tradable shares of the ETF in the secondary market. ETFs issue shares in what are known as creation units. The vast majority of ETFs have creation unit sizes of 25k, 50k or 100k shares.

When a ‘new’ fund comes to market, they are usually seeded with at least 2 units of the fund. There are very few examples of ETFs that come to market with more than $5mm in AUM or an excess of 200k shares outstanding. One recent exception comes to mind: Pimco’s BOND launched with ~$100mm AUM and 1mm shares outstanding.

Understanding that ETFs have to start somewhere, it would be difficult to explain how more than 55% of ETFs (excluding ETNs, Leveraged ETFs and Inverse ETFs) have garnered AUM in excess of $50mm.

In other words, someone had to take a close look and invest into the funds. The ‘I will if you will’ mentality is probably not how the most successful fund managers find ways to outperform.

Ten of the top thirty performing ETFs year to date have AUM below $50mm.

(EGPT, TAO, HGEM, IFAS, SOYB, PKB, RTL, QQQV, ROOF and RWW)

Congratulations to the pioneers who ‘went it alone’, as they say. Continue reading