Tag Archives: hyg

virtu says no to corporate bond etf market-making

Virtu Says NO to Corporate Bond ETF Market-Making

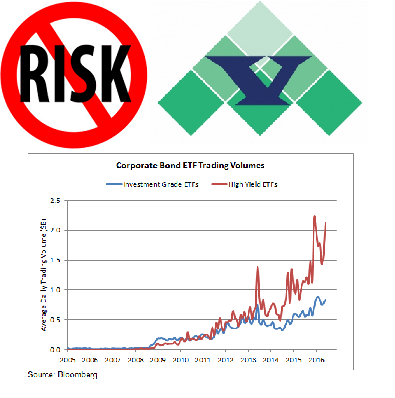
Virtu Says NO to Corporate Bond ETF risk-taking; Top Market-Maker Opines “Unable to Hedge ETF Constituents Due To Limited Liqudity”

During the better part of three years, MarketsMuse Fixed Income curators have often pointed to concerns expressed by market professionals who argue that the unfettered growth of corporate bond ETFs are masking the inevitable likelihood that once interest rates begin to rise, buy side fund managers fearful of mark-downs in their corporate bond positions will push the ‘sell button’ en masse to limit the P&L hit. Those in the camp expressing such concerns, which includes Virtu Financial, one of the most successful electronic market-makers in the industry, believe that such a mass exodus will wreak havoc on the now $8.4 trillion US corporate bond ecosystem* (*data according to Sifma), where new issuance for 2016 has just surpassed 1 Trillion dollars, and is a marketplace that since 2011 alone, has grown nearly 50% in terms of notional value and number of outstanding issues.

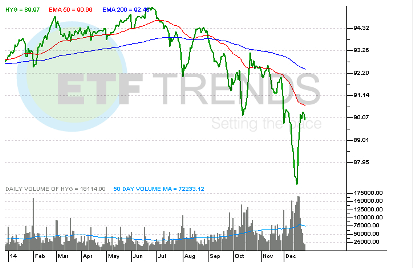
Per one senior market risk expert familiar with the thinking at Virtu, “Their’s isn’t simply a view typically attributed to academics, who have increasingly warned and have been equally derided by ETF lobbyists for suggesting a secondary market meltdown in corporate bond ETF products is inevitable when rates rise. Instead, Virtu has concluded that for those who make a business of ‘taking the other side’ of corporate bond exchange-traded funds, whether investment grade (e.g $LQD) or high yield themed (e.g $HYG), will find themselves playing a game of musical chairs, but there will be no chairs available for anyone when the music stops and traders will find themselves unable to find any liquidity in the respective ETF underlying constituents.”

Below opening excerpt from mainstream media outlet Bloomberg LP and reported by Bloomberg reporter Annie Massa:

One of the world’s largest electronic market makers won’t touch increasingly popular corporate bond ETF products because the underlying securities are too hard to trade.

Although New York-based Virtu Financial Inc. buys and sells everything from stocks to government bonds and futures on more than 235 exchanges around the world, it shuns products linked to corporate bonds like the $15 billion iShares iBoxx $ High Yield Corporate Bond ETF. The reason, according to Chief Executive Officer Doug Cifu, is that it’s too hard for Virtu to precisely hedge the trades.

“It’s definitely concerning you don’t have full and unfettered access to the underlying,” Cifu said, speaking at a Security Traders Association conference in Washington on Thursday. “That’s troubling.”

During the fourth quarter of 2015, TABB Group interviewed key US corporate bond market participants across buy-side, sell-side and specialized trade service providers.Across all segments covered within the survey, participants’ responses reflected dim expectations for liquidity available in the US corporate bond market for 2016. Apart from the threat of a “large scale macro crisis,” the most serious threat that participants identified was the ongoing decline in immediacy (balance sheet) provided by dealers.

Worldwide assets in bond ETFs have surged in recent years, jumping fivefold since January 2010 to about $600 billion, according to data compiled by Bloomberg. About 88 million shares of fixed-income ETFs have traded daily in the U.S. during the past 30 days, according to data compiled by Bloomberg.

Other market makers including Citadel Securities and Susquehanna do trade the ETFs, but Virtu’s absence is notable given how dominant the company is in other areas. Cifu said Virtu does trade ETFs containing U.S. Treasuries, including the ProShares UltraShort 20+ Year Treasury.

To read a Bloomberg Markets profile of Virtu, click here.

Virtu’s strategy involves arbitraging price difference in related assets, quickly entering and exiting the positions. With fixed-income ETFs, the company is concerned it can’t get access to the related bonds fast enough. Market makers with longer trading time frames may be less reluctant. Virtu’s line of thinking echoes worries elsewhere in the industry. Shares of the funds are often easier to trade than their underlying bonds, potentially posing a risk if there’s a sudden rush for the exit.

To continue reading, please click here

junk-bond-etf-liquidity

Junk Bond ETFs-The Liquidity Debate Goes to SEC

MarketsMuse ETF and Fixed Income curators have frequently spotlighted the ongoing debates as to whether corporate bond ETFs, and in particular, junk bond-specific exchange-traded-funds pose special risks. Some argue that a liquidity crisis could unravel the high yield bond sector if/when institutional investors decide that risk of recession continues to ratchet higher, leading all of those investors to run for the exit at the same time, and in turn, causing a reverberation across the ETF market. The counter side to that thesis is that corporate bond ETFs (NYSE:HYG among them) are insulated from the risk of a catastrophe that might envelope the underlying components (the actual bonds themselves). One thing that is certain is that the US SEC is not certain, and they’ve raised the volume on this topic.

Adding light to this topic is WSJ columnist Ari Weinberg, someone who is arguably one of the best educated members of the 4th Estate when it comes to ETFs, and Monday night column deserves our kudos and sharing select extracts…Roll the tape..

junk-bond-etf-liquidity-crisisMost investors in mutual funds and exchange-traded funds probably don’t worry much about liquidity. After all, fund shares can be bought and sold easily anytime online, and trades are completed in one to three business days.

But there is another layer of trading—the trading the funds themselves do when a wave of selling by investors requires the funds to sell some of their assets—that has the Securities and Exchange Commission worried about liquidity. And the commission wants investors to be more aware of the risks it sees.

The issue is particularly pertinent for the fixed-income fund market, because assets that some of those funds hold are very thinly traded. Here’s a look at what’s involved.

Deciding between the two isn’t always straightforward. Here’s help clarifying the differences and similarities.

The SEC’s concern is that some mutual funds and ETFs might hold too many securities that aren’t easy to sell quickly. As a result, the funds might not always be able to adjust their holdings without “materially affecting” the funds’ net asset value per share, the commission said in its September announcement of proposed new liquidity-risk management rules. In other words, selling a substantial amount of illiquid securities quickly could drive down their price, resulting in a big loss for a fund, lowering its value.

Among other things, the proposed rules would require funds to categorize the liquidity risk of their holdings according to how many days it would take to sell the assets without greatly affecting their market price, and disclose those risk assessments to investors. The SEC also proposed to strengthen and clarify an existing guideline that no more than 15% of a fund’s assets should be held in securities that would take more than seven days to convert to cash.

Several ETF issuers, as well as the Investment Company Institute, a fund industry trade group, have said in comment letters that the SEC’s proposals aren’t relevant to most ETFs, because the funds are structured differently from mutual funds.

Mutual-fund investors buy and sell their shares directly from or to the fund. So mutual funds regularly need to sell assets on the open market to pay investors who are redeeming their shares. But ETF shares are traded among investors, not between investors and the fund. So most ETFs usually don’t have to sell assets when investors sell their shares, because the shares are being bought by other investors, not being redeemed by the fund.

ETF shares are only created or redeemed, and the underlying assets bought or sold, when doing so is necessary to keep the market price in line with the net asset value of the fund’s holdings. Those transactions are done between the funds and financial institutions called authorized participants, or APs, which often also serve as market makers in the ETFs and other securities.

Here is how it works in most cases: If heavy selling is driving an ETF’s market price below the fund’s net asset value, a market maker, acting through an AP or acting as an AP itself, will buy up shares and deliver them to the fund in the form of a so-called creation unit—taking them off the market—in return for an equal value of the underlying assets held by the fund. It’s then up to the trading firm to decide if it wants to hold those assets or sell them.

The argument ETF issuers are making to the SEC is essentially that this process insulates ETF investors from the dangers of a fund having to sell illiquid securities on the open market.

The opposing argument, made by the SEC and those who favor the proposed new rules, is that there is a risk that the AP might not be willing to take on assets that are very hard to sell quickly, throwing a wrench into the whole process of keeping the fund’s net asset value in line with its share price. That would be reflected in a widening of the bid-ask spread for the ETF—the difference between the price investors can get for selling shares and the higher price they would have to pay to buy the shares.

The concern that this could happen to a fixed-income ETF is based in part on changes in recent years in the fixed-income markets. Financial institutions in general are more averse to the liquidity risk that some debt securities pose, in part because of increased regulation governing the institutions’ risk exposure. Investment banks, for instance, hold 80% less corporate bond inventory than a decade ago.

Ultimately, according to many traders and market participants, concerns around ETFs and fixed-income holdings will only be mitigated when there is more transparency in the market, as more securities are quoted and traded electronically. Currently, only about 10% to 25% of the secondary trading in corporate bonds—depending on the amount of each bond in the market and the issuer’s credit quality—is electronic. The rest is done via online messaging and phone calls.

Continue reading Ari Weinberg’s dissertation directly via the WSJ


bond etf liquidity

Calling for Clarity: Corporate Bond ETF Liquidity

There continues to be a call for clarity with regard to the topic of corporate bond ETF liquidity and where/how corporate bond ETFs add or detract within the context of investors ability to get ‘best execution’ when secondary market trade in underlying corporate bonds is increasingly ‘illiquid.’

This not only a big agenda item for the SEC to wrap their arms around, it is a challenge for “market experts” to frame in a manner that resonates with even the most knowledgeable bond market players.

MarketsMuse curators noticed that ETF market guru Dave Nadig penned a piece for ETF.com last night “How Illiquid are Bond ETFs, Really?” that helps to distill the discussion elements in a manner that even regulators can understand.. Without  further ado, below is the opening extract..

“Transcendent liquidity” is a somewhat silly-sounding phrase coined by the equally silly Matt Hougan, CEO of ETF.com, to discuss the odd situation in fixed-income ETFs—specifically, fixed-income ETFs tracking narrow corners of the market like high-yield bonds.

But it’s increasingly the focus of regulators and skeptical investors like Carl Icahn. Simply put: Flagship funds like the iShares iBoxx High Yield Corporate Bond ETF (HYG | B-68) trade like water, while their underlying holdings don’t. Is this a real problem, or a unicorn?

Defining Liquidity

The problem with even analyzing this question starts with definitions. When most people talk about ETF liquidity, they’re actually conflating two different things: tradability and fairness.

Tradability is actually a pretty simple concept: How well will the market let me get in or out of an ETF? And for narrow fixed-income ETFs (I’m limiting myself to corporates, in this analysis), most investors should be paying attention to the fairly obvious metrics, e.g., things like median daily dollar volume and time-weighted average spreads. By these metrics, a fund like HYG looks like the easiest thing to trade ever:

On a value basis, the average spread for HYG on a bad day of the past year is under 2 basis points. It’s consistently a penny wide on a handle around $80, with nearly $1 billion changing hands on most days. That puts it among the most liquid securities in the world. And that easy liquidity is precisely what has the SEC—and some investors—concerned.

Fairness

But that’s tradability, not fairness. Fairness is a unique concept to ETF trading. We don’t talk about whether the execution you got in Apple was “fair.” You might get a poor execution, or you might sell on a dip, but there’s no question that your properly settled trade in Apple is “fair.”

In an ETF, however, there is an inherent “fair” price—the net asset value of the ETF at the time you trade it—intraday NAV or iNAV. If the ETF only holds Apple and Microsoft, that fair price is easy to calculate, and is in fact disseminated every 15 seconds by the exchange.

But when the underlying securities are illiquid for some reason (hard to value, time-zone disconnects or just obscure), assessing the “fair” price becomes difficult, if not impossible.

If the securities in the ETF are all listed in Tokyo, then your execution at noon in New York will necessarily not be exactly the NAV of the ETF, because none of those holdings is currently trading.

Premiums & Discounts

In the case of something like corporate bonds, the issue isn’t one of time zone, it’s one of market structure. Corporate bonds are an over-the-counter, dealer-based market. That means the iNAV of a fund like HYG is based not on the last trade for each bond it holds (which could literally be days old), but on a pricing services estimate of how much each bond is worth. That leads to the appearance of premiums or discounts that swing to +/- 1%.

To read the full article, please click here

HYG v VIX

High-Yield Credit Spreads, HYG and VIX-Reading The Tea Leaves

MarketsMuse followers have been reminded more than a few times that conventional wisdom requires investors to keep their eyes on corporate bond spreads so as to have a clear lens when considering the outlook for equity prices on a medium-to-longer time frame. The relationship between high-yield debt,most-often measured by HYG (the high-yield bond exchanged-traded fund) and VIX–the latter of which is an often misunderstood metric, is a telling indicator for stock investors. And, those who are experts at reading the tea leaves are pointing to red flags on the horizon..

Courtesy of CNBC, Neil Azous of Rareview Macro and Andrew Burkly of Oppenheimer, two of the industry’s most sensible pundits discuss the cause and ramifications of the recent junk bond sell-off, pointing to high yield bond ETF $HYG as a meter benchmark to in the video below..

Global Macro Strategy: Get Short-y

MarketsMuse global macro strategy insight courtesy of extract from today’s a.m. edition of Rareview Macro LLC’s “Sight Beyond Sight”, which includes references to the following ETFs: EMB, HYG and LQD.. For those already subscribing to “SBS”, you already know that this market strategist incorporates a cross-asset model portfolio that has outperformed a significant number of those who oversee billions of dollars on behalf of the world’s most demanding investors.

Neil Azous, Rareview Macro

New Tactical Trade – Short German DAX…Model Portfolio -33% Net Short Equities

US Dollar Input – Not Just “Patient” and “QECB” but also Balance Sheet Management

Credit – Watch EMB, HYG, LQD Today

Model Portfolio Update – March 6, 2015 COB:  +1.04% WTD, +0.89% MTD, 0.00% YTD

This morning, in the model portfolio we sold short the German DAX. Specifically, we sold 200 GXH5 (DAX Mar15) at 11485. This is a short term directional trade. The notional equates to 20% of the NAV. The update was sent in real-time via Twitter.

All in, between the S&P 500 and DAX, the model portfolio is approximately-33% net short equities. To put it in simple terms, there is an opportunity right now to short the market. Why? Because, either the FOMC Committee blinks, and you get paid until they do, or they do not blink and you get paid as risk assets discount further interest rate normalization. Either way, your short position will make you money.

Here is the best way to describe our sentiment at the moment: Continue reading

Option Traders Aim For More Declines in Junk Bond ETFs

MarketsMuse update courtesy of extract from ETFtrends.com column by Senior Editor Todd Shriber..

ETFTrends-logoExchange traded funds holding high-yield debt have stumbled this year due in large part to sliding oil prices. Some options traders are betting on further declines for the iShares iBoxx $ High Yield Corporate Bond ETF (NYSEArca: HYG), the largest junk bond ETF.

Options hedging against swings in HYG “cost the most since 2010 versus those on an ETF following Treasuries and were at an almost six-year high relative to contracts on a Standard & Poor’s 500 Index fund,” report Inyoung Hwang and Jonathan Morgan for Bloomberg.

HYG is off 3.1% this year, but the ETF’s declines and those of its rivals have worsened in the back half of the year as oil’s slide has gained speed. HYG is off 5.6% over the past six months as the United States Oil Fund (NYSEArca: USO) has plunged nearly 47% over the same period.

The message from the options market regarding HYG is clear: More declines are on the way.

“About 56,000 bearish and bullish options changed hands daily on average in December, compared with an annual mean of less than 23,000 through the end of November,” according to Bloomberg.

As oil prices have tumbled, high-yield corporate bond investors have become skittish due to the rising influence of the energy sector within the U.S. junk bond market. Energy issuers account for 15% of the U.S. high-yield market, up from less than 10% seven years ago. [Oil Will Drag Junk Bond ETFs Down]

Oil and gas issuers account for 13.5% of HYG’s weight, the ETF’s second-largest sector allocation behind a 14.9% weight to consumer services.

Then there is the matter of increased leverage. At the end of the second quarter, U.S. shale producers had a total of $190.2 billion in debt, up from less than $150 billion at the end of 2011, according to Bloomberg data.

For the entire story from ETFtrends.com, please click here.

Mr. Shriber has been involved with financial markets for over a decade and has been writing about ETFs for over seven years. Prior to joining ETF Trends, Mr. Shriber was the chief ETF analyst at Benzinga. His written work has appeared on MarketWatch, Minyanville and Investopedia, among other web sites and major daily newspapers such as the New York Times and Washington Post.

Junk Bond ETFs: SOS for HY Sector ($USO, $XOP, $JNK, $HYG)

etf-logo-finalBelow extract is courtesy of Oct 13 edition of ETFtrends.com and senior editor Todd Shriber

The United States Oil Fund (NYSEArca: USO) is off 6.4% in the past month as West Texas Intermediate, the U.S. benchmark oil contract, ominously descents to $80 per barrel.

Oil’s slide has wrought havoc for futures-based ETFs, such as USO, as well as scores of equity-bae funds with energy sector exposure. After a 9.5% third-quarter loss, was once the top-performing sector in the S&P 500 earlier this year has now turned into one of the worst groups. [Dour View on Energy ETFs]

Of the 25 worst-performing exchange traded funds over the past month, 12 are equity-based energy funds. However, weakness in the energy sector could be problematic for some an asset class some investors may not be overlooking as a victim of energy’s slide: High-yield bonds and the corresponding ETFs.

Booming production at the Eagle Ford Shale and other shale formations has helped make Texas the envy of large state economies. That same theme has also been viewed as one of the more favorable long-term catalysts for ETFs ranging from the SPDR S&P Oil & Gas Exploration & Production ETF (NYSEArca: XOP) to the Market Vectors Unconventional Oil & Gas ETF (NYSEArca: FRAK), but oil’s decline is threatening producers ability to profitably tap North American shale plays. [Fracking ETFs Foiled by Slumping Oil Prices]

“Texas is the anchor to shale production, employment growth, positive real estate trends, and overall positive moral. With Crude Oil at or below the cost of production for many project, the State with the highest economic multiple needs to contract,” said Rareview Macro founder Neil Azous in a research note.

But there’s more, including the threat falling oil prices pose to the high-yield bond market. Continue reading

Chasing Yield Chapter 3: High-Yld Corporate Bond ETFs v. Bank Loan ETFs

etfcomlogoBelow extract courtesy of  ETF.com and reporter Cinthia Murphy

When it comes to capturing yield in the corporate debt space, ETF investors are showing a preference this year for senior bank loans over high-yield corporate bonds. That preference, some argue, is largely due to what looks like an overvalued junk corporate bond segment, but it is a choice that has its trade-offs.

In a recent webcast discussing his views on the market, DoubleLine’s Jeff Gundlach pointed out that in 2014, he has opted for bank loans over high-yield corporates for that very reason: overvaluation in the high-yield segment. But as one advisor recently asked, “Is there any asset today that isn’t overvalued?”

The S&P 500 is up 200 percent from its March 2009 lows without serious signs of economic expansion; long-dated Treasurys are at multi-month highs, rallying in tandem with the stock market this year; and riskier fare such as emerging markets are in back in vogue. “Overvalued” could be a relative term these days.

Consider two ETFs as proxy for these separate segments: Continue reading

ETF Investors Step Up Their Short Game in Junk Bonds

wsj_printCourtesy of Chris Dietrich, WSJ

After last month’s bond market selloff, many investors are hunting for strategies that can still provide high yields but won’t get hurt by rising interest rates.

Increasingly, they are turning to exchange-traded funds focused on short-term junk bonds, which promise those investors just what they are looking for.

Pacific Investment Management Co.’s Pimco 0-5 Year High Yield Corporate Bond ETF soaked up $602 million since the start of May, just as rates started to tick higher, according to IndexUniverse. The SPDR Barclays Short Term High Yield Bond ETF took in $318 million.

At the same time, investors are heading for the exits in longer-term high-yield bond funds.

The iShares iBoxx $ High Yield Corporate Bond ETF saw outflows of $1.4 billion since May. State Street Global Advisors’ SPDR Barclays High Yield Junk Bond ETF lost $1.8 billion.

Shorter-term ETFs have proved the better option during the latest bout of market duress. Both styles of junk-bond ETFs lost ground last quarter, but the short-term variety’s declines are less severe.

The Pimco 0-5 Year High Yield Corporate Bond ETF and the SPDR Short Term High Yield ETF lost less than 1%, including coupons dividends, in the second quarter, according to Morningstar. The iShares and State Street longer-duration funds, meanwhile, declined more than 2%.

And so far in 2013, the short-term funds returned more than 1%, while their counterparts are in the red.

“Shorter-term junk bonds are lower volatility, so in a downdraft there’s a lot less downside than regular junk bonds,” said Chun Wang, co-portfolio manager at Leuthold Weeden Capital Management, an investment manager based in Minneapolis. Continue reading

James Grant: Short $LQD Before Bonds Fall

indexuniverseCourtesy of Olly Ludwig

Sooner or later the bond market is going to start falling, and a perfect exchange-traded vehicle to play the unraveling of the more than three-decade rally in fixed-income markets is “LQD,” a corporate bond fund that happens to be one of the largest fixed-income ETF in the world, James Grant told attendees at IndexUniverse’s Inside ETFs conference this week.

But Grant, the editor and publisher of Grant’s Interest Rate Observer, said that while he is short the iShares iBoxx $ Investment Grade Corporate Bond Fund (NYSEArca: LQD), it’s terribly difficult to time such trades, as markets are “unreliably efficient” and “reliably inefficient” and, moreover, the Federal Reserve’s loose-money policies since 2008 essentially mean that interest rates are not in a free market.

Grant’s comment about LQD came in response to a question from IndexUniverse Chief Executive Officer and founder Jim Wiandt, who introduced Grant and asked what investors—faced with the prospect of the end of a secular bull market in bonds since the early 1980s—should now do.

“Short,” said Grant. “I’m short something called LQD.”  The ETF, the iShares iBoxx $ Investment Grade Corporate Bond Fund (NYSEArca: LQD) is quite liquid and has $24 billion in assets under management.

Grant, a longtime critic of the Fed and a proponent of a return to the gold standard, was the grand finale at the 6th Annual Inside ETFs conference, which took place in Hollywood, Fla. from Feb. 10-12. The event, which has become the see-and-be seen event in the world of ETFs, was attended by nearly 1,300 people, most of them financial advisors and fund sponsors. Continue reading

ETFtrends: Are High-Yield Bond ETFs Overvalued After Big Run?

etftrends logo imagesCourtesy of John Spence

Junk bond ETFs have enjoyed four solid years of returns while investors’ hunger for income-producing assets has pushed the sector’s yields down near record-low levels. As 2013 gets underway, some investors are again wondering if high-yield corporate debt is overvalued after such a strong run.

The only problem is that investors don’t have too many other options when it comes to finding yield with the Federal Reserve committed to keeping rates low for a couple more years.

“With record fund inflows in 2012, investors clearly have an appetite for high-yield bond funds,” says Morningstar analyst Timothy Strauts. “The strong investor demand lowered credit spreads, and the high-yield category returned over 14% last year. While yields have been falling, high yield is the only bond category with a 12-month yield still above 5%.”

SPDR Barclays High Yield Bond (NYSEArca: JNK) and iShares iBoxx High Yield Corporate Bond (NYSEArca: HYG) are the largest ETFs that invest in high-yield corporate debt. The funds were big sellers in 2012 and allow investors to buy a basket of high-yield bonds with one trade and low fees.

The sector’s rally has pushed the average yield on speculative grade bonds below 6% for the first time ever. [Junk ETFs Highest Since 2008]

Fed-fueled bubble?

“One of the aims of the Federal Reserve interest rate policy is to increase risk-taking across the capital markets. High yield is one of the main beneficiaries of the Fed’s current policy. With yields of investment-grade securities below 3%, investors have been forced to look elsewhere for income. Many institutional investors that in the past only chose investment-grade bonds have been buying high yield to meet their return targets,” says Strauts at Morningstar. Continue reading

Popular ETFs You Should Never Use..

  Courtesy of CNBC..By: Lee Brodie

Exchange traded funds are among the more popular ways to trade. Called ETFs on the Street they allow investors to diversify risk through a basket of stocks.

A pro like trader Steve Grasso of Stuart Frankel who works on the floor of the NYSE, can barely move a foot or two without hearing “Buy the XLF or get me out of the GLD, now!’

But these and other popular ETFs may not always be your best bet.

According to Matt Hougan, IndexUniverse president of ETF analytics, there are alternative ETFs that aren’t as widely known, but may actually better serve your needs. He profiled five of them on CNBC’s Fast Money. They follow:

Sector      Widely Traded
Gold                  GLD

Hougan’s Alternative: IAU

Looking at the GLD, Hougan says the IAU  holds exactly the same thing. “It’s plenty liquid and owning it is about half the cost of the GLD.”

Sector         Widely Traded
Financials                XLF 

Hougan’s Alternative: IYF

Hougan says this is something of a popularity content. “People know the XLF .” However, the XLF only tracks large caps. (Click here to see top holdings on Yahoo! Finance.) If you want exposure to the entire banking sector Hougan recommends the IYF  for “the full spectrum.” Continue reading

The Global Chase (Race) to Capturing Yield; High Yield Bond ETF Update

Courtesy of Paul Amery, IndexUniverse.eu

On a longer-term view, last month’s US$1.3 billion net outflow from high-yield bond ETFs looks like nothing more than a blip.

Fixed income trackers are currently the fastest-growing sector of the ETF market and, within that category, high-yield (or “junk bond”) funds have recently attracted the greatest interest. The two largest US-listed funds of this type, iShares’ iBoxx $ High Yield Corporate Bond ETF (NYSE Arca: HYG) and State Street’s SPDR Barclays Capital High Yield Bond ETF (NYSE Arca: JNK) have added around US$10 billion in new assets since October, taking their combined size to nearly US$25 billion.

High-yield ETFs now constitute around 3 percent of the overall junk bond market and generate around 10 percent of the daily trading volume in such bonds, one market observer told IndexUniverse.eu.

ETF evangelists talk of the transformational role being played by such funds in what is traditionally a relatively illiquid sector of the market.

“We’re bringing a revolution to the high-yield bond market by increasing liquidity and pricing transparency,” a senior executive at one ETF issuer told IndexUniverse.eu last month.

“In this prolonged low-rate environment, we continue to see investors turn to high-yielding alternatives…and we’ve cautioned investors accordingly about reaching for yield,” says Vanguard’s CEO, Bill McNabb.

On the face of it, publicly available data support ETF managers’ contention that their funds can offer superior liquidity to the underlying bond markets.

iShares’ flagship European high-yield bond ETF, the €1 billion Markit iBoxx Euro High Yield Bond fund (LSE: IHYG), has traded on its primary (London) listing with an average bid-offer spread of 31 basis points since the fund’s inception in September 2010. By comparison, the weighted average bid-offer spread on the constituent bonds of the ETF’s underlying benchmark, the Markit iBoxx Euro High Yield index, has averaged over three times more during the same period, at 95 basis points.

Trading Costs For IHYG And Its Underlying Index Continue reading

ETF Fund Flow: Trumping Mutual Funds

According to technology and trading firm ConvergEx Group, during the first 6 weeks of 2012, more than $8 billion has flowed in to U.S. Equity ETFs, while nearly $8 billion has “flown out” of U.S. equity mutual funds.

“Some of the commentary surrounding these products has made them sound like the hoof beats which precede the Four Horsemen of the Apocalypse,”  said Nicholas Colas, ConvergEx’s Chief Market Strategiest, alluding to various critiques of ETFs that have emerged over the past 18 months, notably Kauffmann Foundation reports that blamed ETFs for a dead U.S. initial public offering market, and argued huge short interest in some funds could pose systemic risk.

“If you want to understand how investment capital flows play into the year-to-date rally for risk assets, the world of exchange-traded funds is essentially your ‘One Stop Shop,’” Colas said in the note, stressing that whatever negative comments are being made about ETFs, they are a great way to gauge overall sentiment in financial markets.

“But for 2012, you can just as accurately call them the most visible source of capital to help U.S. stocks and other risk assets higher,” Colas wrote.

Most Popular Funds

As far as the individual funds that have really “Killed it” in year-to-date asset gathering this year-to-date, Colas said the ETFs that have pulled in over $1 billion include:

  • iShares iBoxx $ High Yield Corporate Bond Fund (NYSEArca: HYG)
  • iShares MSCI Emerging Markets Index Fund (NYSEArca:EEM)
  • iShares Russell 2000 Fund (NYSEArca:IWM)
  • iShares $ Investment Grade Corporate Bond Fund (NYSEArca: LQD)
  • Vanguard MSCI Emerging Markets ETF (NYSEArca:VWO)
  • Powershares QQQ (NasdaqGM QQQ)
  • SPDR Barclays High Yield Bond ETF (NYSEArca: JNK)
  • SPDR Gold Trust (NYSEArca: GLD)

Apart from the strong push into U.S. equities, Colas said emerging markets and precious metals are coming back into favor, with inflows of $9.1 billion and $2 billion, respectively.

”We’ve noticed a trend now for at least a year where investors use country-specific funds in lieu of regional products,” Colas said, singling out a number of those funds that have gathered more than $100 million dollars in new investments since the start of the year.

Among those are:

  • iShares FTSE China 25 Index Fund (NYSEArca: FXI)
  • iShares MSCI China Index Fund (NYSEArca: MCHI)
  • iShares MSCI Germany Index Fund (NYSEArca: EWG)
  • Market Vectors Russia ETF (NYSEArca: RSX)
  • iShares MSCI Chile Index Fund (NYSEArcaECH).

“I have no doubt that mutual fund flows will eventually turn positive, and we’ll have to keep an eye on this trend when it develops,” Colas said.

“But for now, exchange traded funds look to be the horse pulling the market’s proverbial cart.”