Tag Archives: global macro trading

stock_forcaster-stock-market-pundits-2022-SPY-marketsmuse-warren-buffet

September Cycles & Stock Market Pundits

September (and October) are typically the most negative time periods for stock market investors, and to illustrate this seasonal pattern, this year is no different. And, stock market pundits are once again in the limelight.

First, if you are a CNBC enthusiast, stop reading here. Our MarketsMuse team has voted unanimously for you to cut the chord if your investment horizon is longer than 1-4 days. The stock market pundits on that program are, for the most part, day traders whose holding period on a particular trade is shorter than the days you would keep milk in your ice box.

(Editor Note: THEIR DEFINITION OF “INVESTMENT” IS BASED ON ANNUALIZED RETURNS; if they can make 1% -2% inside of two or three days, the odds are you won’t get the memo that they took their profits and ran! The odds are greater still that any of those folks who appear daily will admit that they took a loss two days after their ‘pick’ plummeted by more than 5%.)

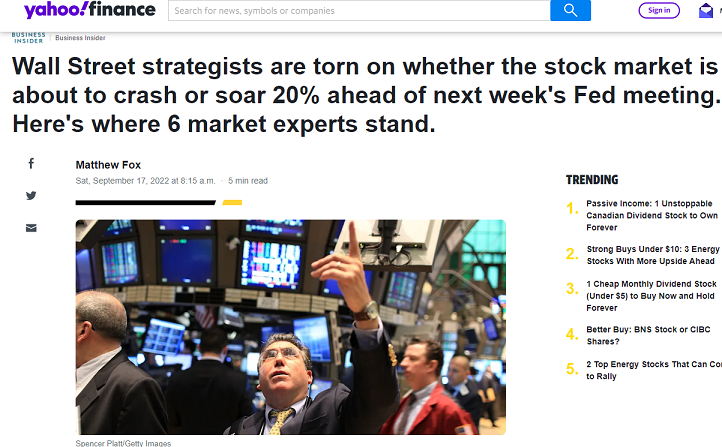
Second, if you do follow financial news headlines, you might already appreciate that every major investment bank, whether it be JP Morgan, Goldman Sachs, Morgan Stanley or Bank of America, has its own pundits whose internal views are diametrically opposed to each other. Why would you be a “High Networth Client” of any of these firms, when they can’t even agree internally on how to advise you?! Good question.

In June of this year, and then again in July, JP Morgan’s 66- year old Chairman & CEO Jamie Dimon, who is no novice when it comes to financial market assessments, was vociferous in his view that equities markets were facing a pending hurricane. Yet the same day in June that Dimon became a front page ‘bomb thrower’, his very highly-paid Chief Market Strategist Marco Kolanovick advised JP Morgan clients to “buy the dip”, as the 46-year-old ‘genius’ predicted US stocks (as measured by S&P 500) “will likely rally and close the year unchanged”.

At Bank of America, Chairman and CEO Brian Moynihan (62 years old) has remained an ardent bull throughout the ups and bigger downs of 2022, while his Chief Market Strategist has been as grizzly as an angry bear since the beginning of the year. Goldman Sachs’s top guns have leaned toward the less-than-optimistic view for most of the year, following the lead of its Chairman David Solomon. Morgan Stanley CEO James Gorman has been been a bull for much of the year, and his Chief Market Strategist, Mike Wilson has been pounding the bear table, as he had been since early 2021.

All of this proves that broken clocks can be right at some point.

So, what is an investor (and or a CNBC ‘short-term trader’) to do, knowing that September-October time sell-offs are the best advertised “upcoming crisis events” since long before Millenials were even born?

MarketsMuse has been following an assortment of stock market pundits, ‘technicians’, and global macro experts for months. The stock market pundits have reliably proven to be wrong, simply because most of them are employed by asset managers and investment banks whose primary purpose of existence is to sell investment products to confused investors. The notion of advising clients to “stay in cash until there is more clarity” is the last thing they would advise, until after the stock market has rebounded 25% from its lowest point. And in bear markets, that is precisely the time to lighten up, not to enter.

The chartists have proven prescient (with bearish medium-to-long term views, and while various global macro gurus have been somewhat blind-sided thanks to “not anticipating extent of Russia-Ukraine fiasco to “discounting what the Fed meant and what they heard the Fed say”. The global macro pundits who take into technical analysis along with the assortment of pillars within the global macro playbook have, for the most part, been telling you to be wary of buying stocks since the Fed went into QT (Quantitative Tightening) mode.

Lesson to be learned: NEVER FIGHT THE FED; regardless of what Jim Cramer spews.

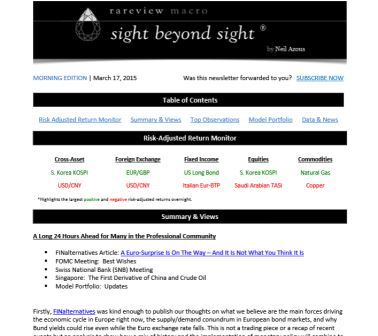
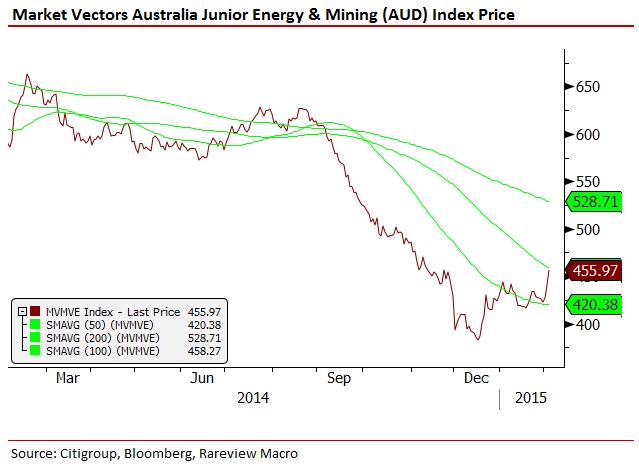
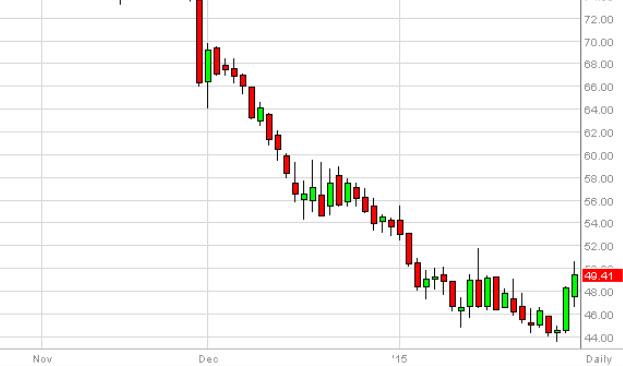
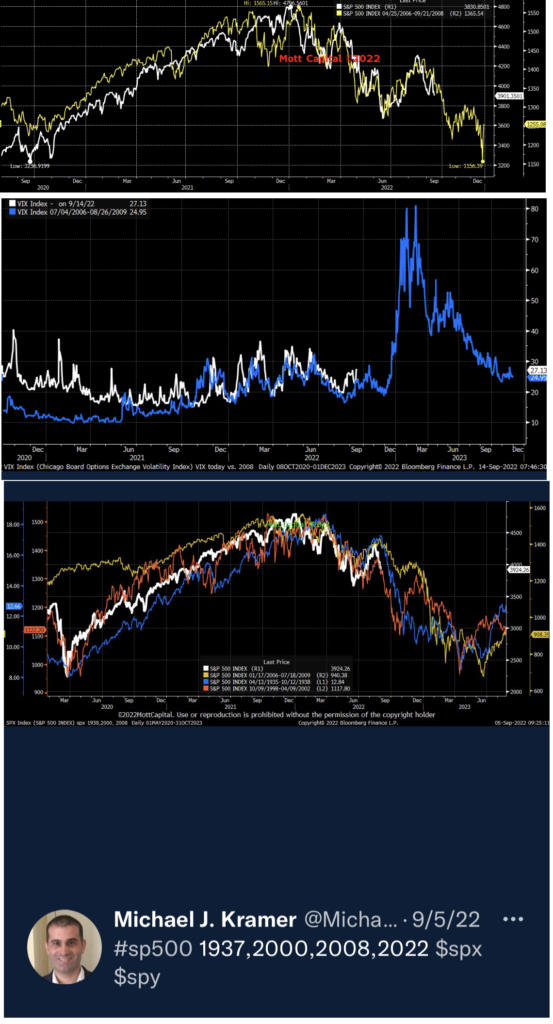
We can tell you that two of the more objective market experts that we’ve followed include Michael Kramer of Mott Capital and Neil Azous of Rareview Capital. Both of these 40-something students of financial markets have proven prescient throughout the year.

Kramer operates a relatively small hedge fund, yet is not beholden to bomb throwing and his humility factor is rare. While his equity-focused fund strategy is benchmarked to the S&P500 and that fund’s performance is still slightly negative on the year to date, his short-term trading calls have proven to be rock solid. Kramer is clearly a fan of all things technical, and his daily tweets and article posts on Seeking Alpha have made for great short and medium-term forecasts. Below are excerpts from charts that he has posted in recent weeks.

Rareview Capital’s Neil Azous layers his fundamental research (which incorporates rates, FX, energy, and geopolitical risk metrics) on top of technical charts. For example, in late April, after the S&P 500 had fallen from 4600 would to 4200, Azous sent a letter to a close-knit group of the world’s most sophisticated investors and warned of a fall down to 3600. Two weeks later, many (but not all) Wall Street analysts pivoted from bullish to bearish and bid on to Azous’s forecast. Azous then re-iterated his less than sanguine view in mid-May, suggesting S&P 500 (would likely go below 3400 before the worst was over).

Throughout the year, Bridgewater Capital’s Ray Dalio, viewed as one of a unique breed of global macro thought-leaders) has been an outspoken bear, even if it took him until recently to ballast his firm’s exposure to Chinese equities. While Wall Street stock market pundits have been pushing the buy the dip strategy, Dalio’s Bridgewater has reported 30% gains on investments. He’s still a bear; Dalio suspects the next 10 years will fall into the category of “another lost decade”.

From a historical perspective (yes, Matilda, history does it repeat itself!), and taking into account 2022 stock investors have suffered their worst start to a year since 1970, consider the following factoids that we sourced from across the ethernet:

  • According to APNews, bear markets since World War II have taken an average of 13 months to go from peak to trough, whereas the average time for the stock market to recover stands at 27 month
  • Forbes 08-24-22*  “In fact, the average length of a bear market for the S&P 500 is just 289 days. That’s not a typo. Just over 9 months and the average bear market is done. Finished. Not only that, but once the market turns around, the average bull market runs for 991 days or 2.7 years. Not a bad deal for investors. The bear market in the S&P 500 was confirmed on June 13th, 2022, but the market began its slide on January 3rd 2022. With this date as the start of the current official bear market, the average bear market of 289 days means that it would finish on the 19th of October 2022.
  • So there you go, the bear market will end, based on the historical average, in the Fall and the good times will be back by Christmas. * https://www.forbes.com/sites/qai/2022/08/24/the-average-bear-market-lasts-289-days-how-long-do-we-have-left/?sh=66f6e5245d5d
  • Raymond James’ historical performance of the S&P 500 Index throughout from `1926 through March 2017. The average Bear Market period lasted 1.4 years with an average cumulative loss of -41%.
  • Felix Richter / Statista.com June 2022  https://www.statista.com/chart/27616/length-and-depth-of-the-latest-s-p-500-bear-markets/bear Bear markets are not an everyday occurrence, thankfully, with the latest one being just the fourth in the 21st century. Looking at past bear markets all the way back to the 1970s indicates that things could very well get worse before they get better. In the previous seven bear markets, the S&P 500 dropped by an average of 38 percent before turning around and it often took years before the index had recovered all of its losses and returned to its previous peak.
  • Across the 10 bear markets since 1950, the longest was 929 days and the shortest was 33 days. Since 2000, there have been only three bear markets not including this one. One of those was history’s shortest; Bear markets, even the long ones, have always given way to bull markets
  • 1973-1974  48% decline, 69 months to break even..
  • 1980- 20 months; then 3 months to break even
  • 2008- 50% decline and two years to break even
  • S&P 500 bear markets since 1946 have taken an average of 389 calendar days to bottom, and then another two years to return to their prior high.
  • We are currently experiencing the 22nd bear market since 1929
  • The average loss of bear markets to reach the bottom before turning back up since 1929;  37%, Median 33.5%
  • The average length of a bear market is 344 days, median of 240 days (best case 2 years, outside 3 years)
  • 1990 bear market lasted 31 months
  • Nine of the 12 bear markets since 1948 have been accompanied by recessions, according to investment research firm CFRA
  • From peak Dec 1972, it took 8 years and 8 months  (to July 1980) for SP500 to achieve break even. Then it rallied 25% over the next 2 years, then fell 30% over the following two years into Aug 1983; not returning to a high point until January 1985
  • 2000-2007 was the lost decade.  Let’s not forget 2008-2013; prices peaked in late 2007, and did not achieve ‘break even’ until April 2013… Slightly higher (before adjusting for inflation) vs SP high of 2000.  So that’s actually a lost decade and ½.
  • According to investment analysis firm Seeking Alpha, the average duration of an S&P 500 bear market since the 1920s has been 289 days or about nine and half months. (The shortest, in March 2020, during the onset of the COVID-19 pandemic in the US, lasted just one month.) On average, the S&P 500 declined about 36% during those bear periods. 
  • But more recently, the 14 bear markets since World War II have averaged 359 days, or close to a year, according to Bespoke Investment Group.
  • Analyzing all the bear markets since World War II, Ben Carlson of Ritholtz Wealth Management found it took 12 months to go from “peak to trough,” or from the end of a period of growth to hitting rock bottom. That means the current bear market would bottom out at the beginning of 2023, a year after January’s peak.
  • Jan 2022, famed chartist Larry Williams predicted a series of declines and rallies, yet argued S&P500 would close the year higher. Yikes.
  • One of the shortest bear markets: Feb 2020 to Aug 2020, it took only 9 months to break even (more precisely, the shortest bear market in recent history Jan 2020 to Oct 2020 (pandemic era, the QE era with near-zero interest rates)
  • 2016 A recent study from Oxford University found that “returns on stocks with the most optimistic analyst long-term earnings growth forecasts are substantially lower than those for stocks with the most pessimistic forecasts.” In other words, your investment portfolio would be better off if you did the exact opposite of what most Wall Street analysts advise.

If you have a comment, a contribution or a tip, please reach out to us

global-macro-view

Global Macro Guru Says: Look Out Below

MarketsMuse curators are often most inspired by views expressed by those dedicated to interpreting and positing financial market outlooks via a global macro lens. This ‘style’ requires a disciplined process and for those who are best in the practice of this dark art, the projections are often prescient. With that, we point to opening commentary courtesy of  global macro guru Neil Azous via  ‘Special Sunday Night Edition’ of “Sight Beyond Sight”, a daily publication produced by global macro think tank, Rareview Macro LLC and one that is followed by many of the top hedge funds across the globe.

neil azous-global-macro
Neil Azous, Rareview Macro

The majority of conversations over the weekend were centered on the breakdown in the momentum factor in US equities. Given how deeply embedded this factor is into all strategies built over the last 18-months, the tentacles are far reaching, including observations on the value versus growth style, large versus small capitalization, quantitative strategies, the performance of TMT funds, defensive rotation, etc.

Since this newsletter is forward-looking – sight beyond sight – we will not rehash those conversations or illustrate the back-tests of past episodes of momentum unwinds that have been published.

However, there are a few important observations to recognize.

Firstly, the world’s most sought after top-down strategists are united in calling for the momentum unwind to continue. In fact, some were quick to begin to take victory laps on their forecasts for this event so the last thing they want to do is relinquish their trophies so soon. At this point, vanity is all that is left for some even if their broken clock is right twice per day.

Secondly, a lot of ink has been spilled over the last six months on the narrow market leadership – FANG, NOSH, Top 10 basket, Top 20 basket, etc. We highlight this because unlike the sell-off in January that was driven by hedging and index futures flows this sell-off is being driven by the long selling in the narrow leadership – single stocks – which makes up a disproportionate amount (i.e. 40-45%) of the S&P 500’s market capitalization. Put another way, there is no hedge to this type of selling except to reduce risk outright.

Thirdly, there are a lot of kids with rulers out there drawing straight lines on a chart. In fact, we did not even have to data mine very hard at all to find key breaks in many relationships. While these illustrations are subjective depending upon what technical analysis discipline you subscribe to, the fact is that for the moment they are self-fulling to the momentum unwind narrative and you have to live with them for a while. We have included a few for your amusement in the Top Observation section below.

In our experience, there are two types of momentum unwind.

The first one is the normal run-of-the-mill unwind due to irrational exuberance in valuations and an extended positioning in consensus strategies.

The second one is related to changes in cycles.

It is a bad combination when all three – valuations, positioning, and cycles – converge as is the case now, in our opinion.

Regardless of which bucket you want to place the current episode into, the reality is that these exercises tend to last 2-3 months, and in some cases when the world is really in bad shape, as many currently feel it is, can last 6-months or longer.

The key point here is that to expect a resumption of momentum or a recovery of that factor’s leadership this early in the unwind, especially considering the PnL duress in the professional community is currently more violent than the losses suffered in January, would be misguided.

Put another way, if there is a momentum strategy, style relationship, market capitalization, sector rotation, you watch daily, and it is down or has reversed by 5-10%, call us when it is down or has reversed by 20-30%, and we will take a look at it.

Finally, ask yourself this question:

If the EURO STOXX 50 Index (SX5E), German DAX (DAX), NASDAQ 100 (NDX), Russell 2000 (RTY), and Facebook-Amazon-Netflix-Google (FANG) all made new “closing lows” for 2016 last Friday, then is it more likely that the next move for global risk assets is a bounce or that the Nikkei 225 (NKY) and S&P 500 (SPX) will play catch up?

The answer to that question, along with other insights can be found by those who read the entire Sunday Night Special Editor of Sight Beyond Sight. To do so, please go directly to Rareview Macro’s archive section via this link (Subscription Required, but Free Trial Subscriptions are still being offered)

Global Macro View-Friday’s Stock Rally In Perspective

MarketsMuse curators have canvassed assortment of guru-types who have attempted to decipher Friday’s stock rally, along with tuning in to the abundance of Monday morning quarterback views. For those who turn to the cartoon channel (i.e. CNBC), some pundits call it a dead cat bounce, more optimistic professional traders and pontificators would like to believe the spike on Friday is a sign of a “bottoming formation”–irrespective of many signals that suggest the “R-word” will become more frequently used when describing the state of the US economy. Smarter money, particularly those who have Sight Beyond Sight are focusing on following a private weekend comment summarizing last Thursday’s email newsletter from global macro think Rareview Macro…

neil azous-global-macro
Neil Azous, Rareview Macro

Factually the 14-day (Relative Strength Index) or “RSI” on the SPX Index is now 39; no one with a straight face can say the market is oversold technically. Last week, when the S&P futures bounced off the lows the professional community was open to the notion that the index could trade back up into the 1920-1960 range. That has not happened despite three key things:

  1. President Draghi has backing of the Committee now to ease policy further;
  2. The FOMC was dovish and the implied probability of a hike in March now is at 18% (it was ~28% yesterday); anything below 20% most likely means it’s going to zero; unconditional probability of June is exactly 20%; post-March FOMC that is most likely around 33% or 3 to 1 AGAINST;
  3. Crude oil has taken out last week’s highs multiple times and broken the downtrend channel today on an intra-day basis. Additionally, the market has removed the majority of event risk related to Yen and Nikkei heading into the BoJ meeting tonight on the view that if the BoJ eases they go big (20 bonds, 1-3 ETF, and even cut IOER) because they can’t risk an incremental easing that the market rejects.

The key question is with largely every asset now discounting these central bank events and the high degree of correlation of risk assets to crude oil, especially the S&P 500, why has the S&P not responded and traded up to the expected range of 1920-1960?

The answer is that tomorrow the BEA releases their quarterly update for corporate profits (Bloomberg Ticker: CPFTYOY Index). Last quarter it was down -5.74%. The key point being is that tomorrow brings a likely confirmation of two-quarters in a row of declining profits – or a “profit recession”. Remember, this is a clean look at profitability and there are no footnotes like a company specific earnings release that can attempt to paint any Picasso they want.

Additionally, ISM Manufacturing data is released on Monday and in order for the cyclical call bounce to begin to materialize it can’t show another print to the downside. Right now the market has shifted to a 40-50% probability of a forthcoming recession up from 10-20% to start the year. Confirmation of further ISM Manufacturing weakness will only accentuate the view that 11 of the last 13 recessions included ISM Manufacturing printing below the 50 level.

So while you may have to wait for two-quarters in a row of negative GDP at some point in the future to get formal confirmation of a recession, the risk is that corporate profits and manufacturing will govern risk assets for the time being and outweigh the heavy emphasis the Ph.D. community places on the consumer and a services-driven economy for now.

When you marry all of this with corporate earnings season that is now half-way complete, with the exception of Facebook (NYSE:FB), not one icon company has had a good print or said something truly positive in the outlook. In fact, AAPL is very close to touching its 200-week moving average like Russell 2000 and Transports. The last time that happened was during the GFC.

Finally, Friday was month-end and the bulls will lose the call for further pension re-balancing that showed equities were very large to buy. The risk now, with all of the oversold conditions worked off, is that the S&P 500 resumes its downtrend and like every other risk asset the 200-week moving average of 1704 is a magnet.

Interest Rate Probability Dispersion Post-FOMC:

  • Hike Twice March AND June: 6%
  • Hike Once March OR June: 36%
  • NO Hike At All by June: 58%

Rareview Macro is the publisher of “Sight Beyond Sight“, a subscription-based advisory service for professional investors, hedge funds and self-directed investors and offers actionable trade ideas using futures, options, and ETFs within the framework of a disciplined analysis process. Author Neil Azous publishes intra-day updates re model portfolio and trade posts via Twitter @rareviewmacro


oil-global-macro-slippery-slope

Oil-Slippery Slope for Traders and Pundits Alike-Except One..

(SubstantiveResearch.com). Trading oil or simply just talking about where, when and why this commodity will assert a more predictable pricing direction has proven to be a slippery slope for professionals and pundits alike. Expressing views via the actual barrel (WTI) or via an ETF (e.g. USO, BNO etc) has been challenging for the best of traders who have spent the last number of months trying to catch a falling knife, or at least pinpoint a trend that doesn’t slip through their fingers. Neil Azous, from global macro think tank Rareview Macro has spent some time this week discussing switching out of his bearish views on oil and its correlated asset classes should the right signals appear.

The idea being that should oil take out last week’s highs (i.e. step 1), and that move is then confirmed by breaking the upside of the downward channel (i.e. step 2), he would start buying the correlated exposure (MSCI EM, high-yield, RUB, TIPS etc). Well, step 2 was breached yesterday, but only on an intraday basis, not on a closing basis. So technically it’s not confirmed, but it is moving in the right direction.

neil azous-global-macro
Neil Azous, Rareview Macro

While Rareview still holds the view that oil may go back and retest, or take out recent low prices before bottoming, Azous has some interesting observations about oil positioning that makes going long enticing. He reckons there is a very clear agenda from the professional community to label the reversal in prices as the long awaited bottom in crude oil and that there is now a genuine exercise underway to engineer higher prices by joining the long crude oil position. Of course the idea that OPEC and non-OPEC may co-opt in production cuts takes this a step further, but it’s just wishful thinking at this stage. Azous goes on to discuss CTA positioning, expectations for IMMs later today, oil’s correlation with the MSCI, which will be of interest to those looking to put on an actionable proxy trade/hedge related to the above narrative.

Click the below link to access Rareview’s archive, or to receive this report.

Request publication

wrong way first trade global macro

2016-Global Macro-The Wrong Way First Trade

You don’t need to be a MarketsMuse or a global macro guru (or any other type of pundit) to know that professional financial market traders are only as good as their last best trade. In that spirit, we look to the 2016 outlook and spotlight on the Wrong Way First (WWF) Trade courtesy of Rareview Macro’s Neil Azous and Sunday night special edition of Sight Beyond Sight–which included a wink and a nod to astrology-friendly traders who swear by the “Bradley Effect”

marketsmuse neil azous rareview macro cnbc oct 6 2015You’re Only as Good as Your Last Best Trade

  • Wrong Way First (WWF) Trading Explained
  • WWF Driving: High Yield (Ignition), Chinese Yuan (Accelerator), US Jobs Report (Speeding Ticket)
  • WWF Candidates: Two Real (Japan & Momentum) & Two Fakes (Styles & FANG)
  • New Trade:  Short EURGBP Spot Exchange Rate

Wrong Way First (“WWF”) Trading Explained

  • Wall Street Jargon: Wrong Way First
  • Acronym: WWF
  • Reference: The risk the professional investment community is exposed to at the beginning of every New Year – that is, the first major trade will be a reversal in the consensus positioning and lead to significant PnL duress.
  • Time Frame: 20 calendar days or in this year’s case US equity options expiration on January 22, 2016.
  • Candidates: Trend, momentum, sentiment, position, faith-based extremes (not fundamental)
  • 2015 WWF Examples: S&P 500 and Swiss franc
  • 2014 WWF Examples: Japanese Nikkei and Chinese yuan carry trade strategies

While it is true that substantial wealth is only really created over time (i.e. by investing sensibly), the money management business is still a slave to the Gregorian calendar and that means performance resets at the close of business on December 31st.

Put another way, if you manage money for a living you’re only as good as your last best trade.

Therefore, it should be of little surprise that professionals begin every January more focused on not getting caught up in a New Year’s malaise rather than trying to take advantage of opportunities by adding new risk or pressing legacy positions.

While there are many key conversations underway to start 2016, it is important to highlight that the dominant theme emerging from our discussions with the risk takers we know is concern over a WWF trading theme materializing. Such is the nature of this business, especially for absolute return strategies.

Following a flat-to-negative performance in 2015, our interpretation of these conversations is that, for most investors, there is very little tolerance to withstand PnL duress around any theme that is a current WWF candidate.

It should be noted that the sensitivity to start 2016 is also elevated on account of the much higher than the normal market beta that would be associated with this theme – short commodities and emerging markets.

If you apply this theme to actual positioning it reveals that the top WWF candidates across the major asset classes are:

Equities 

  • RV: Long Japan and Europe vs. Short/Underweight US
  • Quantitative: Long US and EU 12-month momentum
  • Style:  Long Growth vs. Short/Underweight Value
  • Market Cap: Long US large vs. short small caps
  • Sector: Long Banks
  • Directional: Long stock baskets (FANG, NOSH, Top 20)

Currencies 

  • Long USD vs. short c/a deficit (ZAR, TRY, BRL)
  • Long USD vs. short crude oil (NOK, CAD, RUB)
  • Long USD vs. short Chinese yuan (USD/CNH)

Cross-Asset

  • Short Gamma

Fixed Income

  • Short US front-end
  • Long US flattener (2yr/10yr and 5yr/30yr)
  • Long 5-10yr Italy vs short Germany Bunds

Commodities

  • Short crude oil
  • Short base metals
  • Long EM oil importers vs. Short exporters

Credit

  • Long US vs. short EU High Yield

Personally, while we are mindful, if not darn right respectful of WWF trading, it is not a strategy we look to exploit largely because we are process driven. Additionally, it is our experience that in general contrarian strategies perform badly because they get on the wrong side of trending markets. By that, we mean that the big themes have the ability to persist for a number of years. They do not mean-revert after one year or simply because the Gregorian calendar undergoes its annual reset.

So not only do we tend to side with the majority who look to “weather” a potential 20-day storm, but we hope that a WWF trading event actually materializes and creates enough dislocation to enter positions at much better prices than we initially envisioned to start the year, and at the same time reveal which trends are strong- or weak-handed.

That said, we recognize this is a newsletter and many of you want to actively trade.

So in that spirit, here are the most important questions and answer related to WWF trading to start 2016.

Before that, it should, however, be noted that this year begins with an added twist.

Sometime in the next 72 hours, there will be a “Bradley turn date”. (H/T CP)

The Bradley Siderograph (literally: star chart) is illustrated below but those who use astrology, numerology and cycle analysis to forecast market turns are highlighting this indicator as a catalyst for risk asset weakness.  The 2016 Bradley Siderograph Turn Dates are in green. The first one is January 5, 2016, or this Tuesday.

Note that the siderograph looks like a price chart with smooth sloping lines going up and down. However, the turn dates are only indicators of a change in the trend – not in the direction of the markets.

bradley siderograph


While we are not ourselves great believers in the ability of the stars to influence the markets, just as we don’t read our horoscopes, it is important to recognize that more professionals follow this indicator than they care to admit in public. For example, disciples of Bradley give themselves a +/-4-day grace period and argue that Equities and Gold are the two assets most prone to turning when it does.

With that in mind, however, here are three things we are watching down here on earth.

WWF Driving – High Yield (Ignition)

  1. Which asset class matters the most, or is the ignition switch?
  1. Answer = US High Yield Credit
  1. Which market proxy is second most important, or the accelerator pedal?
  1. Answer = Chinese yuan (CNY)
  1. Which event in the first week of the year breaks the speed limit?
  1. Answer = Monthly US Employment Report (this Friday)

See the below correlation matrix that shows how the various market proxies are all a “One Beta” trade – they’re all going in the same direction.

To continue reading the 3 January edition of Rareview Macro’s Sight Beyond Sight, please click this link (subscription is required; free trial available without need to insert credit card)

Its All Greek..A RareView View…

As the events in Greece escalate to a frenzy, global macro strategists are lining up to opine on what might happen as the EU and the world calculate the impact of a Grexit. MarketsMuse tapped into one of the industry’s most thoughtful strategists and one who is notorious for having both ‘sight beyond sight’ and inevitably, a view that is rare when compared to those who position themselves as “opinionators.”  Without further ado, below is the extracted version of the 29 June edition of “Sight Beyond Sight

Neil Azous, Rareview Macro

  • Key Talking Points…What People Are Watching…Major Asset Prices
  • US Fixed Income – Choke Yourself If  You Believe in 2 Rate Hikes in 2015
  • China – Correction Accelerates Government Learning Curve & Possibly IPO Reform


We started working early yesterday morning, spending time on the phone with as many risk takers as possible around the world and listening in on numerous bank conference calls on the unfolding events. Additionally, we felt compelled to watch our screens all night. At the time of writing, we have not actioned one item in our model portfolio and are nowhere near able to aggregate the thoughts of the risk takers we respect or the market commentary we received from anyone who writes research for a living. The fact is there is no coherent sentence to write. The dust has yet to settle, and until it does, no one can claim to know what will happen.

Despite all of this market plumbing being very visible, and even after the Greece referendum news on Friday, the probability of a disorderly financial reaction due to its consequences has only risen to ~40% from 20% or less based on what we can gather. Leaving last week many held the view there was a 50-50 probability for a resolution with a bias for a positive outcome.

Now let’s go through the asset classes and products, and ask how they will perform. For ETF players, our lens is on GREK, FXI, HEDJ and necessarily, SPY. For those looking for an immediate take-away trade with regard to the overwhelming Greek-infused chitter chatter and jibber jabber, think $GLD. In this case, our view, which we have espoused for more than 15 minutes, might or might not be  ‘rare’, but its one we can hang our hat on…

Prudent risk management says that the overriding exercise now is to take risk down regardless of your bias on the outcome. Resolution strategies are a distant second place and with US employment Thursday followed by a three day weekend that includes this Greek referendum, that makes this scenario that much more likely.

In terms of Greece, many are watching/waiting for the ECB reaction function to the Emergency Liquidity Assistance (ELA), which is scheduled to be revisited on Wednesday. As a reminder, the events in 2012, in which there was a large spike in the ELA program assistance as a result of Greece, was the catalyst for the now famous “do whatever it takes” speech by ECB President Mario Draghi. Ironically, the three-year anniversary of that speech is coming up shortly and there is no question professionals want to see Draghi re-ignite the European recovery trade. Our point is that faith in him being a steward of the market remains unwavering and he is still the only person perceived as the class act in this goat rodeo.

If we had to pick one asset that we all were led to believe mattered in the context of a “Grexit” over the last five years, and that was supposed to react to that event, it would be Gold. It should be up $50 at a minimum and yet it can barely hold a bid. If you feel bad for the citizens of Greece, then please save a little sympathy for the Gold terrorists at the failure of the yellow metal to respond today. Next week, if things get worse, and gold still fails to respond, that could be the final nail in their coffin. At least there will be one good outcome to the whole sorry saga. Continue reading

Greece and The True Pain Trade-A Rare Global Macro View

The True Pain Trade in Yields and Euro…Not the Wall Street Pain Trade of Equities

Greece, Grexit and the notorious ‘pain trade’ commentary below is courtesy of MarketsMuse’s extracted rendition of today’s above-titled edition of “Sight Beyond Sight”, the global macro commentary and investment insight newsletter published by Rareview Macro LLC. Added bonus: a thesis for trading EEM.

Neil Azous, Rareview Macro

Those like us who have been in this business for some time will be familiar with Futures Magazine, a cornerstone property of The Alpha Pages and its sister publication FINalternatives. Their new flagship publication, Modern Trader, has just been launched and hit the newsstands last week. The full publication can be viewed HERE (Password: prophets). Our article “Riding The Dollar Bull” begins on page 28. We were pleased to be a centerpiece of this inaugural issue and would like to use this moment to wish CEO Jeff Joseph and Editor-in-Chief Daniel Collins the best of success in this new endeavor.

The True Pain Trade in Yields and Euro…Not the Wall Street Pain Trade of Equities


The professional community is fixated on a “pain trade” – that is, a durable European equity relief rally that lifts all other risk assets in sympathy.

The “Shenzhen-style” bid in European equities this morning argues in favor of that theory and clearly validates the view that risk reduction has been thematic the past two weeks and professionals are left without enough of a position should risk assets continue to appreciate.

This is where this theory stops working, however.

We think this is the wrong way to think about what a Greece resolution means for asset prices going into the third quarter of 2015 and it also tells you why this conversation is about much more than just a 5-10% rally in the German DAX.

Now those who have followed us for years appreciate that we actually have two definitions for the widely-touted phrase “pain trade” – one for the true meaning – that is, lower prices because that leads to investors actually losing money – and one for sales people on Wall Street – that is, some terminology that makes them  sound like a “cool kid” who is “in-the-know” for their hedge fund clients who do nothing more than try to capture 60% of any market move up or down so they can justify their existence for a bit longer.

While we appreciate that the “cool kids” believe equity markets can go higher, we think real investors, ones that are not forced to be “close to the Street”, are much more concerned about a breakdown in the correlation of the European carry trade relative to the US dollar.

Let us explain what we mean…

The three drivers of global macro investing during 2012-2015 have been and still are:  the US Carry Trade (SPX + UST 10-yr), the Japanese Yen, and the US dollar.

The additional driver of global macro investing during 2015 is:  EU Carry Trade (DAX + German 10-yr BUND).

Now, let’s combine a key long-term driver with the additional driver…In today’s edition of Sight Beyond Sight, we provide our readers with an illustrative of the EU Carry Trade (DAX + German 10-yr BUND) versus the U.S. Dollar Index (DXY), and a detailed thesis as to our proposed trade idea.

Model Portfolio – New Position – Emerging Markets Book Hedge

On Friday, in the model portfolio, we spent 10 bps of the NAV and added a long emerging market volatility position in the portfolio overlay return stream to protect the existing long risk positions in the Real-Yen (BRL/JPY) and crude oil (CLX5).

Specifically, we purchased 10,000 iShares MSCI Emerging Markets ETF (EEM) 06/26/15 C41– 39.5 option strangles for $0.31. For the purposes of this model portfolio being liquidity verified, not just time-stamped, we paid $0.02 through the asking price.

Given the binary risk around possible Greek capital controls, we were genuinely shocked to see that such a trade existed in the marketplace. Additionally, the hedge was cheaper than using S&P 500-related options, and has a higher correlation to the Greek stock market. This makes EEM one of the best kept secrets in the market.

The break-even for the trade at the time of execution was 2.23% by next Friday, or exactly the historical 1-sigma move by the end of this week. On a 2-sigma move, the expected profit return is 2.5:1.

On further analysis, we discovered that about 33% of the weekly occurrences during the last 12 months (i.e. last 52 weeks) exceeded the expected 1-sigma move, and that doesn’t even include the potential Greek risk next week!

Ultimately, this means that upon entering the trade there is statistically a 1 in 2 probability that we turn a profit on the position. We like those kind of odds.

Neil Azous is the founder and managing member of Rareview Macro LLC, a global macro advisory firm to some of the world’s most influential investors and the publisher of the daily newsletter Sight Beyond Sight.


Global Macro: Decomposing the Move in Yields-The Pendulum Swing

Decomposing the Move in Yields…Global Fixed Income Coming Closer to Decoupling from German Bunds

MarketsMuse Global Macro and Fixed Income departments merge to provide insight courtesy of “Sight Beyond Sight”, the must read published by global macro think tank Rareview Macro LLC. Below is the opening extract from 10 June edition.

Neil Azous, Rareview Macro

Firstly, please note this morning’s Model Portfolio Update: Crude Oil, XLU/SPY, IYR/SPY, FXI: As per yesterday’s edition of Sight Beyond Sight, we added to existing long positions in Crude Oil, XLU/SPY and IYR/SPY. The update was broadcast in real time via @RareviewMacro.

Now, on to the day’s primary talking points..

The confidence level in the professional community remains low. The attack on the Dollar-Yen (USD/JPY), which had its largest one-day drop since August 2013, was just another casualty of the search and destroy mission underway in overall asset markets. The fact is that there is no model–valuation, technical, or otherwise–that can handicap the speed and the degree of the backup in global yields. The overriding question remains: “When will global yields stop going up, and when can the rest of fixed income decouple from German Bund leadership?”

Risk-Adjusted Return Monitor Summary & Views Continue reading

Crude Oil-This Global Macro Trading Expert Says This About That

MarketsMuse Global Macro Trading dept. merges with our ETF dept. to provide the following excerpt profiling a compelling and conservative Crude Oil-centric strategy courtesy of global macro think tank Rareview Macro LLC. The following was posted to subscribers of “Sight Beyond Sight” on Wednesday, May 27. Irrespective of subsequent three day’s pricing and trade activity across crude oil marketplace, MarketsMuse editors have determined the strategy proposed by Rareview Macro’s Neil Azous remains ‘evergreen’ (for the time being).

Neil Azous, Rareview Macro

Today we got long on WTI crude oil in the model portfolio. Take it for what it’s worth, but this is the first time we have traded Crude Oil during this entire corrective phase stemming back to last summer. As per the March 18th edition of Sight Beyond Sight, when we put a long crude oil strategy on our watch list for a reduction of the severe contango in the futures curve, we are finally comfortable with the risk profile, especially considering volatility has been reduced by more than half since then. Sadly we did not deploy a position on March 18th as it coincidentally was the day the “barrel” bottomed.

The reason we chose to utilize a risk reversal approach today to get long on crude oil is because of the pronounced put skew in the term structure. For example, the structure we entered captures seven volatility points of skew on the ask side.

We like the risk-reward in this position. For example, if the November 2015 crude oil future (symbol: CLX5) were to fall $6 in the next one to two months, the strategy stands to lose ~$1.4mm. Conversely, if it were to rise by $6 in the same time frame the expected profit is ~$3.2mm, which returns a profit ratio of 2.28:1.

Sidebar: A similar strategy can be employed in the US Oil Fund (symbol: USO) by buying the 10/16/15 $21.5 calls and selling the $16 puts, but the ETF position is vulnerable to the shape of the futures curve moving further into contango. Continue reading

Global Macro: Selloff and Noise Level Around European Fixed Income Reach Historic Levels

MarketsMuse Global Macro update is courtesy of opening extract from today’s a.m. edition of “Sight Beyond Sight“, the global macro newsletter published by global-macro think tank Rareview Macro LLC and authored by Neil Azous, Rareview Macro’s Founder and Managing Member.

Neil Azous, Rareview Macro

Forgive our saucy tone today, but this has been a long week. That is not because we were long European bonds, but because we provided a lot of free therapy to people who were. In the last two hours we have received way too many communications around today’s events.  At one end of the spectrum there are those arguing that Fixed Income has crashed, the bond bull market is over, and this is reminiscent of US Treasuries in 1994 or the Japanese JGB move in 2003. And at the other end, today’s reversal off the extreme yield levels seen just a short while ago is leading many to call the move finally over, arguing that supply/demand and the search for income are once again set to take over and force global yields much lower.

We don’t know how either side is able to make either argument with a straight face. Put another way, there are a lot of pikers out there with no accountability or transparency in their views voicing their opinions today. The attempt to analyze fundamentals relative to positioning at climactic moments historically is a poor exercise, especially considering the UK election is today and the US employment number is not released until tomorrow.

Instead, you might be able to make a better argument that the European Central Bank (ECB) was able to meet its bond buying quota very early in the month, and at choice prices and it is best for everyone else to wait until next Monday to go on the offensive. That just seems more rational. Just because we write a newsletter doesn’t mean we have to go on the record today. So we will not and instead regroup over the weekend and come back Monday refreshed.

To be clear, we are not “off-side’s.” We are just more interested in where Global fixed income will be over the next two to three months rather than getting caught up in the next two to three hours. In that spirit, for those who want to fall back on something more fundamental or process oriented instead, the below observations may be of interest.

US Fixed Income Observation

Below is a snapshot of our internal model for US interest rate hike probabilities over the next 18 months. The top graph looks at the total probability of a hike BY a certain meeting, whereas the bottom graph determines the probability of a hike AT a certain meeting. Beyond that, the very affordable cost of Sight Beyond Sight ® newsletter prohibits us from sharing any additional methodology with you. So please don’t ask us. Let’s just say we utilize this tool frequently in our internal process and we place a lot of weight on it. Continue reading

Global Macro: Is The Darling of EM Faltering?; How To Trade It..

MarketsMuse ETF and Global Macro update takes a look at India for those following the two leading ETFs in the space, the $2.3 billion WisdomTree India Earnings Fund (EPI. C-73) and the $1.9 billion iShares MSCI India ETF (INDA. C-92), and introduces a global macro perspective that adds a different dimension via a brief excerpt from today’s a.m.  edition of Sight Beyond Sight and courtesy of Rareview Macro LLC a.m. notes

India: The Darling of EM Faltering

In a very rare occurrence in India, where investors are two-times overweight the equity market benchmark, 49 of the 50 names in the National Stock Exchange CNX Nifty Index (NIFTY Index -2.81%) closed negative. Not only has the ratio of India to Brazil (NIFTY/IBOV) now retraced almost 50% since its mid-2012 ascent higher, but it remains one of the best representations globally of the unwind of the commodity importer vs. exporter strategy that dominated the deflation headlines from July 2014 to February 2015.

Here is an updated version of our favorite representation. This is the Indian SENSEX versus Brazilian Bovespa overlaid with the inverse of WTI crude oil. As you can see, without Brazil even being opened today yet, the Indian leg has taken that ratio down below the 200-day moving average.

For the avoidance of doubt, which is very high in the professional community when it comes to India, after last night’s price action the equity markets are now formally in a technical correction (i.e. -10%) as the NIFTY is -11.36% off its March high. Additionally, the major benchmarks are now negative on the year in both US dollar and local currency (INR) terms. Optically, next to Turkey, India is the only other major emerging market that is negative year-to-date.


Sight Beyond Sight® is a global macro trading newsletter written daily by Neil Azous. With close to two decades of institutional experience across asset classes, Neil interprets the day-to-day economic, policy and strategy developments and provides actionable trading ideas for investors.

Global Macro Trading: Why It’s Time to Stop Hating Apple Inc

MarketsMuse.com Global Macro update necessarily touches on the hyperbole and couch quarterbacking connected to yesterday’s earnings announcement from Apple Inc ($AAPL), which included a big bump in planned corporate share buyback and increased dividend.

Our editors were particularly entertained by below extract from today’s edition of global macro trading commentary produced by Neil Azous, the Founder and Managing Member of Rareview Macro LLC and publisher of “Sight Beyond Sight”. During the past year, and notwithstanding a focus on thematic, macro-style strategies, Azous has published a selection of comments re $AAPL which have proven remarkably prescient. Below snippet is merely a teaser to a more detailed defense of Apple, and the same edition includes a Rareview look at “Gold Terrorists.”

(LATE POST:CNBC staffers were apparently so tickled by the Apple comments from Azous (and specific recommendation below), they demanded that Azous share his tongue-in-cheek comments on air…the video clip is below)

Neil Azous, Rareview Macro

“…On a personal note, we would encourage those professionals who love to hate AAPL to book themselves a series of therapy appointments. It is ok to spend $10,000 and tell a stranger that you are “angry”.

We recommend one session each for the following 10 “issues” for you to work through. In fact, see if you can haggle yourself a discount for a pre-paid 10-pack of therapy sessions.

1. You are “angry” about the fact that their China revenues went to $17 bln from $10 bln and sales in China surpassed the US.

2.You are “angry” about the 70% year over-year growth rate in a country that is supposed to be in a hard landing.

3.You are “angry” about the China stock market impact, i.e. the $4 trillion in new market cap that could be put towards a new iPhone or Watch, and that AAPL is now geared to China.

To read the entire a.m. edition of “Sight Beyond Sight”, including commentary focused on “Gold Terrorists” and the outlook for yellow metal within the context of a sensible investment portfolio, please click here. (Subscription is required; Free Trial is available)….

Global Macro Trading: The Trend is Your Friend, Until It’s Not

MarketsMuse.com global macro trading snapshot is courtesy of excerpt from 7 April edition of macro strategy commentary from “Sight Beyond Sight”, a publication of Rareview Macro LLC and authored by 20-year industry expert, Neil Azous.

Neil Azous, Rareview Macro

Over the past two trading days, three major trends that have been the backbone of asset markets over the past 9 to 15 months have come under attack. As highlighted in yesterday’s edition of Sight Beyond Sight, and despite our call for an immediate reaction lower in risk assets turning out to be wrong, we are now working under the assumption that a larger corrective event in key investment themes is underway.

To be clear, just because we are working under this assumption does not make us feel comfortable about going against the grain as trend-following pays better and is more scalable than counter-trend trading

The first, and most prominent, trend shock is the shift in the US dollar. The uptrend that has been in place for the last nine months is in jeopardy.

The second is the US Treasury curve.

The third is the downtrend in crude oil. Whether it is the trades of commodity exporters against importers, problems surrounding capital account deficit countries with large levels of commodity-dependent debt, or the shale oil-based capital expenditures decline in the United States, there are quite a few negative narratives linked to the decline in crude oil prices.

What we are now considering is this: If crude oil is able to sustain a rally or has finally “found a bottom” then what the consequences are of all of these release valves being opened at once?

To read the finer points of this morning’s edition of Rareview Macro LLC’s “Sight Beyond Sight” inclusive of a detailed distillation of the above talking points and a view of Rareview’s model portfolio, please visit this global macro strategy think tank’s website via this link

Global Macro Trading Theme: Focus on Fixed Income

MarketsMuse.com update provides insight for those who are focused on the global macro approach to a topic that many of the world’s leading hedge funds and professional investment managers are fixated on: fixed income. Below thoughts are courtesy of the 27 March a.m. edition of “Sight Beyond Sight”, the  investment newsletter authored by Neil Azous and published by global macro think tank Rareview Macro LLC.

Neil Azous, Rareview Macro

A few weeks ago we stated that fixed income will provide a greater opportunity to generate positive P&L this year and that we would look to increase our time spent on this asset class. In “fund speak” fixed income would be given a larger portion of the risk budget. In that spirit, we are adding two new strategies to the model portfolio today. Unlike the strategies we’ve outlined over the last few weeks, this is more volatility arbitrage than relative value trading. Specifically, we looked at two Different strategies .The first strategy focuses on 6-month options on Eurodollar futures contracts (symbols: EDU5, EDU8) that are six months and three years from expiration, respectively.

The second strategy focuses on the cross-regional volatility difference between German Bunds and US Treasuries (symbols: RXM5, TYM5). Both strategies were executed earlier this morning in the model portfolio. The updates were sent in real-time via Twitter (@rareviewmacro).

Trade #1: Eurodollar Calendar Ratio Spread

Trade #2: Bund-UST Volatility Arbitrage Continue reading

A Euro-Surprise Is On The Way..A Rareview Global Macro View

Marketsmuse.com blog update courtesy of extract from a.m. edition of Rareview Macro LLC’s “Sight Beyond Sight”, the global macro trading investment newsletter favored by the industry’s leading hedge funds, investment managers and the world’s most savvy self-directed investors.

Neil Azous, Rareview Macro

  • -FOMC Meeting: Best Wishes
    -Swiss National Bank (SNB) Meeting
    -Singapore: The First Derivative of China and Crude Oil

Firstly, FINalternatives was kind enough to publish our thoughts on what we believe are the main forces driving the economic cycle in Europe right now, the supply/demand conundrum in European bond markets, and why Bund yields could rise even while the Euro exchange rate falls. This is not a trading piece or a recap of recent events but an analysis to show how a mix of history and the implementation of monetary policy will combine to generate accelerating growth in Europe. It is basically the culmination of the views that we have been outlining to you since mid-January. If you’d like to read it, you can find it here: A Euro-Surprise Is On The Way And It Is Not What You Think It Is. Continue reading

Global Macro ETF: A Rareview- Look No Further and Look Down Under $MVMVE

MarketsMuse global macro trading insight courtesy of extract from 4 Feb edition of Rareview Macro LLC’s “Sight Beyond Sight” with reference to $MVE and $MVMVE

Neil Azous, Rareview Macro

There are a lot of moving parts overnight, including the continuing debate on whether crude oil has bottomed or not. But if we had to focus on just one part of the narrative it would be Australia – the tentacles of which stretch out all the way to basic resources, yield, beta, deflation, and sentiment.

Now before dismissing any read through from this antipodean nation as not as relevant as other indicators, we would argue that what is happening there may well have more meaningful ramifications for global risk assets than most realize.

Firstly, the Market Vectors Australia Junior Energy & Mining Index (symbol: MVMVE) is showing the largest positive risk-adjusted return across regions and assets for the second day in a row.

By way of background, MVMVE covers the largest and most liquid Australian and offshore small-caps generating 50%+ of their revenues from energy & mining and listed in Australia. This basket of securities is not only highly geared to capex, utilities, infrastructure, and engineering but it is the poster child for Australia-Asia commodity speculation. Put another way, it has been the worst-of-the-worst and a favorite proxy to watch for those who hold the dogmatic view that China and Australia are both zeros.

We do not want to overemphasize the importance of just one index, so we are highlighting it more as a starting point than anything else. It is not uncommon for this index to show up on our equity monitor but it is rare for it to take the leadership across all regions and assets, and very rare for that to happen on back-to-back days. For that reason, it has prompted us to do some further analysis on that food chain.

Model Portfolio Update – Increased S&P 500 (SPY) Short Position Continue reading

Confused About Crude? You’re Not Alone; Global Macro Traders Tongue-Tied

MarketsMuse excerpt from Feb 3 edition of Rareview Macro LLC’s  Sight Beyond Sight global macro commentary..

Professionals Not Discussing Crude Oil Strength…Short Euro Put on Hold

This is simple.

Neil Azous, Rareview Macro

WTI crude oil is now up ~18% from the January 29th lows. It is not a question of whether the bounce continues or worth debating whether a V-shaped or U-shaped recovery is materializing. What is more important is whether a low was made and a new medium-term range is now being carved out.

Now anyone who monitors cross-market correlation will understand that the price of a barrel of Brent crude oil is highly correlated with the inverse of the trade-weighted dollar. Therefore, if the price of oil is stabilizing there is a quantitative argument that the dollar will stop rising, at least in the short-term.

Professionals are highly sensitive to pattern recognition and the last two times the Euro-Dollar (EUR/USD) corrected (i.e. Oct & Dec 2014) the currency cross appreciated by 2.5-3.2%. This is in line with the current bounce off the low price (i.e. 2.6%) following the ECB meeting in January.

So the question is why is it that those who never participated in the first place or those that reduced their long dollar exposure at the end of 2014 and missed the January QE move, but believe the currency cross will trade down to parity (i.e. 100) by the end of this year, have not used this bounce to get short of EUR/USD, especially considering you now have policy confirmation from the ECB? Continue reading

Global Macro Czar Paul Singer Says This About Buying Govt Debt: “Nuts to You!”

Elliott Management Founder Says It’s ‘Nutty’ to Hold Government Debt

Below MarketsMuse extract courtesy of FinAlternatives.com’s afternoon edition (which is courtesy of coverage from Bloomberg LP’s Kelly Bit) is a beauty for those who follow the musings of this global macro trading titan…and the comments are consistent with what makes Paul Singer, well, Paul Singer..

By Kelly Bit (Bloomberg) — Paul Singer, the billionaire founder of Elliott Management Corp., said government policy has encouraged traders to take massive concentrated positions in “fantastically” overpriced markets and that the government bonds of developed countries are at unsustainably high prices.

“Today’s trading levels of stocks and bonds reflect ‘thumb on the scale’ valuations driven by persistent and massive government asset purchases and zero percent (or lower!) short- term policy rates, as well as an essentially unlimited tolerance for risk,” Elliott wrote in the firm’s fourth-quarter letter dated Jan. 30, a copy of which was obtained by Bloomberg News. Continue reading