Below is excerpt courtesy of 07.29 edition of Rareview Macro’s “Sight Beyond Sight”
Small vs. Large Caps
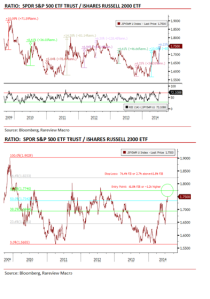
Below are two charts of the ratio of the S&P 500 (symbol: SPY) to the Russell 2000 (symbol: IWM).
The first chart shows the performance of the ratio (i.e. long SPY vs. short IWM) on the top each time the relative strength index (i.e. 14-day RSI) reaches ~70. This ratio is currently overbought.

Going back to 2009 there have been ~10 points in time where the RSI reached ~70 (i.e. overbought) using the standard 14-day period. The average gain in the ratio is ~7.7% vs. the current gain at 6.6% off the July 2014 low.
The second chart shows the Fibonacci retracement levels following the GFC. The 61.8% FIB level is 1.2%. That happens to coincide with the average gain (i.e. ~7.7%) of the last 10 times that coincided with a ~70 RSI.

We have placed an order to buy $20 million of IWM and sell short $20mm of SPY at this 61.8% retracement level. Out stop is the 76.4% retracement level which is ~2.7% above the 61.8% retracement level. That would equate to a loss of ~$540k or ~50 basis points of the NAV. As a reminder, we refer to 50 basis points as one unit of risk.
