Tag Archives: eem

Greece and The True Pain Trade-A Rare Global Macro View

The True Pain Trade in Yields and Euro…Not the Wall Street Pain Trade of Equities

Greece, Grexit and the notorious ‘pain trade’ commentary below is courtesy of MarketsMuse’s extracted rendition of today’s above-titled edition of “Sight Beyond Sight”, the global macro commentary and investment insight newsletter published by Rareview Macro LLC. Added bonus: a thesis for trading EEM.

Neil Azous, Rareview Macro

Those like us who have been in this business for some time will be familiar with Futures Magazine, a cornerstone property of The Alpha Pages and its sister publication FINalternatives. Their new flagship publication, Modern Trader, has just been launched and hit the newsstands last week. The full publication can be viewed HERE (Password: prophets). Our article “Riding The Dollar Bull” begins on page 28. We were pleased to be a centerpiece of this inaugural issue and would like to use this moment to wish CEO Jeff Joseph and Editor-in-Chief Daniel Collins the best of success in this new endeavor.

The True Pain Trade in Yields and Euro…Not the Wall Street Pain Trade of Equities


The professional community is fixated on a “pain trade” – that is, a durable European equity relief rally that lifts all other risk assets in sympathy.

The “Shenzhen-style” bid in European equities this morning argues in favor of that theory and clearly validates the view that risk reduction has been thematic the past two weeks and professionals are left without enough of a position should risk assets continue to appreciate.

This is where this theory stops working, however.

We think this is the wrong way to think about what a Greece resolution means for asset prices going into the third quarter of 2015 and it also tells you why this conversation is about much more than just a 5-10% rally in the German DAX.

Now those who have followed us for years appreciate that we actually have two definitions for the widely-touted phrase “pain trade” – one for the true meaning – that is, lower prices because that leads to investors actually losing money – and one for sales people on Wall Street – that is, some terminology that makes them  sound like a “cool kid” who is “in-the-know” for their hedge fund clients who do nothing more than try to capture 60% of any market move up or down so they can justify their existence for a bit longer.

While we appreciate that the “cool kids” believe equity markets can go higher, we think real investors, ones that are not forced to be “close to the Street”, are much more concerned about a breakdown in the correlation of the European carry trade relative to the US dollar.

Let us explain what we mean…

The three drivers of global macro investing during 2012-2015 have been and still are:  the US Carry Trade (SPX + UST 10-yr), the Japanese Yen, and the US dollar.

The additional driver of global macro investing during 2015 is:  EU Carry Trade (DAX + German 10-yr BUND).

Now, let’s combine a key long-term driver with the additional driver…In today’s edition of Sight Beyond Sight, we provide our readers with an illustrative of the EU Carry Trade (DAX + German 10-yr BUND) versus the U.S. Dollar Index (DXY), and a detailed thesis as to our proposed trade idea.

Model Portfolio – New Position – Emerging Markets Book Hedge

On Friday, in the model portfolio, we spent 10 bps of the NAV and added a long emerging market volatility position in the portfolio overlay return stream to protect the existing long risk positions in the Real-Yen (BRL/JPY) and crude oil (CLX5).

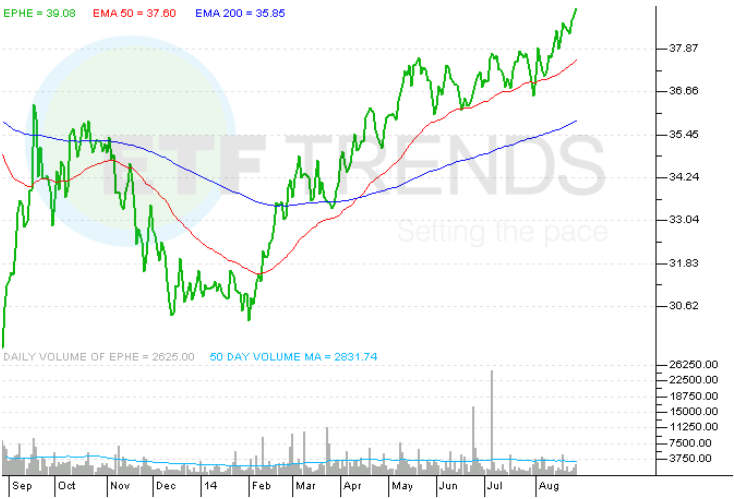
Specifically, we purchased 10,000 iShares MSCI Emerging Markets ETF (EEM) 06/26/15 C41– 39.5 option strangles for $0.31. For the purposes of this model portfolio being liquidity verified, not just time-stamped, we paid $0.02 through the asking price.

Given the binary risk around possible Greek capital controls, we were genuinely shocked to see that such a trade existed in the marketplace. Additionally, the hedge was cheaper than using S&P 500-related options, and has a higher correlation to the Greek stock market. This makes EEM one of the best kept secrets in the market.

The break-even for the trade at the time of execution was 2.23% by next Friday, or exactly the historical 1-sigma move by the end of this week. On a 2-sigma move, the expected profit return is 2.5:1.

On further analysis, we discovered that about 33% of the weekly occurrences during the last 12 months (i.e. last 52 weeks) exceeded the expected 1-sigma move, and that doesn’t even include the potential Greek risk next week!

Ultimately, this means that upon entering the trade there is statistically a 1 in 2 probability that we turn a profit on the position. We like those kind of odds.

Neil Azous is the founder and managing member of Rareview Macro LLC, a global macro advisory firm to some of the world’s most influential investors and the publisher of the daily newsletter Sight Beyond Sight.


Philippines Has Rising Star in the ETFs Market

MarketMuse update courtesy of ETF Trends’ Todd Shriber.

After finishing lower for a second consecutive year in 2014, diversified emerging markets exchange traded funds are off to decent though not spectacular starts in 2015.

Off to a more impressive start than broader peers, such as the iShares MSCI Emerging Markets ETF (NYSEArca: EEM) and the Vanguard FTSE Emerging Markets ETF (NYSEArca: VWO), is the iShares MSCI Philippines ETF (NYSEArca: EPHE). EPHE, the lone Philippines ETF, entered Friday with a 2015 gain of 2.6%, or nearly quadruple that of VWO.

In 2014, EPHE gained more than 22% while EEM and VWO each finished the year in the red. EPHE now resides less than 10% below its all-time high set in January 2013 and more gains could be on the way after stocks in Manila rose to a record during Friday’s Asian session.

Like India, the Philippines is getting a significant economic boost from lower oil prices because the Philippines is dependent on oil imports to help power one of Southeast Asia’s fastest-growing economies. Over the past six months, the U.S. Oil Fund (NYSEArca: USO) has plunged 51%, but the WisdomTree India Earnings Fund (NYSEArca: EPI) and EPHE have traded modestly higher over that period.

Investors are paying up to be involved with Philippine equities.

“Shares in the Philippine Stock Exchange Index are valued at 18.4 times 12-month estimated earnings, the highest since Nov. 26. The gauge has the highest multiple among Asia’s benchmark equity indexes,” reports Michael Patterson for Bloomberg.

The MSCI Emerging Markets Index trades at about 11 times earnings, but that did not prevent EPHE from hauling in $44.3 million in new assets last year. That is nearly 12% of the ETF’s current assets under management, indicating U.S. investors remain underweight Philippine equities. That may not be the case for long.

“The Taiwanese, Philippine and South Korean stock markets also warrant over-emphases on account of their stable political regimes, reliable policymaking climates and healthy economic prognoses,” said S&P Capital IQ.

For 2015, Morgan Stanley “said the Philippines was the best-positioned market due to its ample liquidity, strong forecast gross domestic product growth and low levels of credit penetration,” reports The Star.

A stronger U.S. dollar is helping Philippine stocks beyond lower oil prices. Foreign remittances are now worth more when converted into pesos, helping boost the local economy. EPHE allocates nearly 12% of its weight to consumer sectors.

In fact, the Philippines has already issued dollar-denominated bonds this year, becoming the first emerging market to do so. The Philippines can afford to do that because its external funding costs are low relative to other developing economies and the country has an investment-grade rating from all three major ratings agencies.

For the original article by Todd Shriber from ETF Trends, click here.

Puzzle Palace: What’s a Smart ETF Investor Supposed To Do Now?? Here’s a Rareview..

If this week’s volatility has unnerved you, take a deep breathe, sit back and consider the following assessments courtesy of global macro strategy think tank Rareview Macro and extracts of this a.m. edition of “Sight Beyond Sight.”

The Puzzle

Neil Azous, Rareview Macro LLC

Today’s edition is not meant to be read as us preaching a gospel. Instead it is a collection of the thoughts we have gathered through a number of recent meetings/conversations with investors who take plenty of risk, and it has served us well in the past to just write down what people we respect are saying. Therefore, if at times the opinions below come across as too skewed one way or adopt the tone of a “bomb thrower” just take them with a grain of salt.

In the end, our biggest issue is that it is just a matter of a few hours to a couple of days before all investors catch up and put together a similar puzzle.

That is why you should read this entire edition even if it is lengthy and the only morning note you read. Continue reading

Top Macro-Strategist Says “Now Negative on Index Levels; Bullish on USD..”

MarketsMuse Editor Note: Below comments from this a.m.’s edition of “Sight Beyond Sight” were among several that jumped off the page..

Neil Azous, Rareview Macro LLC

“..Conversely, Technology has moved to the “Weakening” from “Leading” quadrant and Healthcare is now exhibiting the same early stage relative weakness as Technology. The takeaway is that there is a clear rotation into defensive strategies and for the first time in a very long while the leadership (Healthcare/Technology) is the source of funds. Thematically, 2014 has been “a market of stocks instead of a stock market….So the question that needs to be asked is whether a sector rotation has the ability to finally break the SP500 index level range….”
“..We are becoming increasingly negative about the US index levels for the first time in a long while…and we believe that the USD will begin to appreciate..”

Produced by macro strategy think tank Rareview Macro LLC and authored by Neil Azous, Sight Beyond Sight is a daily newsletter that has become a “must read” for leading fund managers and sophisticated investors..Free 2-week trial (without need for providing credit card info!) is a brilliant way to become introduced to the firm’s insight and content. The archive section for the publication is available via this link to the SBS website.

ETF Volatility: The Real Story Behind The [Bloomberg] Story

indexuniverseCourtesy of Dave Nadig’s July 12 column

This morning Bloomberg published a story titled “ETF Simplicity Betrayed by Volatility in Market Selloff.”

In the article, the authors contend that they’ve run the numbers, and that ETFs are just flat-out more volatile than mutual funds. Here’s the lead:

“Share prices for the 10 largest diversified emerging-market ETFs on average were 42.6 percent more volatile than their underlying indexes from May 22 to June 24.”

Let’s break down what they could possibly mean here, and let’s start with a few baselines.

While the article claims it’s not addressing the issue of premiums and discounts—that is, how far off fair value a given ETF closes in market trading versus its underlying index—it’s fairly clear that’s not the case. If it were, then the following chart wouldn’t make sense.

This is a rolling look at the 20-day historical volatility of the iShares MSCI Emerging Markets ETF (NYSEArca: EEM) and the actual index it tracks, over the period in question. I’m looking here at the actual NAV, and as you’d expect, they track extremely closely:

1---EEM-VOL

The bottom line looks at the difference, and you might ask: “Well, why is there any difference at all?”

Continue reading

Institutional Investor: Vanguard’s Risky Switch in ETF Indexes

ii_logo_240px-wide  Courtesy of Rosalyn Retkwa

When it comes to the broad-based emerging-markets equity ETFs, Vanguard’s MSCI Emerging Markets ETF (VWO) is clearly the top dog. As of December 11, VWO had a market cap of $58.66 billion and an average daily volume of 17.74 million shares.

But back on October 2, Vanguard rocked the ETF world when it said it would drop MSCI of New York City as its index provider on 22 ETFs and substitute two other index providers, in the belief that by doing so, it could achieve “considerable savings for the funds’ shareholders over time.” That includes VWO, which will transition to a FTSE index at some unspecified point next year. Vanguard has been deliberately vague about any sort of schedule.

“We’re not saying exactly when the transitions will begin in order to prevent front-running,” says Joel Dickson, a senior investment strategist and principal in Vanguard’s Investment Strategy Group in Malvern, Pennsylvania. “The transitions will be staggered over several months,” he says, noting that VWO “will take longer than the other funds because it will be divesting all of its holdings in South Korea and investing the proceeds in some markets that are less liquid.”

And VWO’s exposure to South Korea is the problem. As of its latest statement on October 31, VWO had a 15.3 percent weighting in South Korea, including its No. 1 stock holding, Samsung Electronics. And that entire position will have to be eliminated when VWO moves from the MSCI index to the FTSE index.

Among index providers, there’s a vigorous debate as to whether South Korea should be classified as emerging or developed, and while MSCI still considers it to be emerging because of stock market and currency constraints, FTSE upgraded it to the developed-nation status in September of 2008, and implemented the change a year later, says Jonathan Horton, the New York City–based president of FTSE North America and head of its exchange-traded product unit. There’s also a budding price war among ETF sponsors.

Dong Lee CFA WallachBeth Capital
Dong Lee, CFA WallachBeth Capital

Still, the change in benchmarks is “a headache” for some institutional investors, says Dong Lee, the director of institutional sales at New York City’s WallachBeth Capital.  It often means they “have to present the investment case for the switch in indices in order to obtain board approval; and there’s a lot of work involved in that,” he says.

But will institutional investors switch to that other big dog of the category, BlackRock’s iShares MSCI Emerging Markets Index Fund (EEM), and in the process pay a much higher expense ratio of 67 basis points versus VWO’s 20 basis points to stick with MSCI? Continue reading

China ETFs: A Chinese Menu of Share Class Descriptions

Courtesy of Dennis Hudacheck

Investing in China is tricky. There are now more than 20 China-focused ETFs to choose from, ranging from size and style funds to sector-specific funds. As if sifting through expense ratios, liquidity and holdings isn’t enough, China investors have another big, fundamental factor to consider: Chinese share classes.

Foreign investment in China is still restricted: A U.S. investor cannot simply open a brokerage account and trade locally listed Chinese shares. As a result, there are multiple shares classes of Chinese companies floating around on various exchanges, allowing investors different ways to access this complex market.

Depending on the underlying index that an ETF tracks, some funds are eligible to hold only a certain type of shares. This matters because the different share classes an ETF is eligible, or ineligible, to hold can significantly impact the fund’s performance, and ultimately determine the type of Chinese companies in the portfolio.

Chinese share classes, especially as they relate to ETFs, are often misunderstood—or worse, ignored altogether. We at IndexUniverse think investors deserve better, so we prepared this document to provide insight and guidance on the topic to help investors make an informed decision on choosing the right China ETF. Continue reading

Russian Equities, ETFs: Cheap And Getting Cheaper

Just because something is cheap does not mean it is a good bargain. Such is life for Russian equities and the relevant U.S.-listed ETFs. Amid slumping energy shares, the “R” in the BRIC acronym saw its benchmark Micex Index slip to a three-month low on Tuesday. The slide comes just a couple of weeks after some analysts and traders started calling attention to attractive valuations among Russian stocks.

In late October, the Market Vectors Russia ETF (NYSE: RSX [FREE Stock Trend Analysis]), the oldest and largest Russia ETF, was spotted trading at its widest discount to the iShares MSCI Emerging Markets Index Fund (NYSE: EEM) in nearly three months.

Since October 29, RSX has slipped almost 5.1 percent as prices have continued tumbling. The Russian government earns about half its revenue from the sale of crude and natural gas, according to Bloomberg.

RSX allocated 41.6 percent of its weight to energy stocks as of October 31, according to Market Vectors data. That would normally be viewed as an excessive weight to just one sector for any ETF, but the iShares MSCI Russia Capped Index Fund (NYSE: ERUS) allocates almost 56 of its weight to energy names. Continue reading

Debunking The Myth re: ETF Spreads

A daily double courtesy of IU’s Dave Nadig

ETFs can be more efficient than the stocks they track, even in surprising places.

At almost every conference and ETFs 101 webinar we do, you’ll hear us saying again and again that spreads matter.

In fact, getting investors to understand the importance of spreads, depth of book, and limit orders make up the bulk of the live trading sessions we do.

After all, next to expense ratios, the spreads and commissions you pay on your ETF trades are one of the only things knowable in advance and, depending on your time horizon, they can have a real impact on your performance.

One of the maxims we always put out there, almost as an oddity, is that ETFs can often be more efficient than the stocks they’re composed of. We usually pull a chart of an extreme case to prove the point: an enormously liquid ETF, like the iShares Emerging Markets ETF (NYSEArca: EEM) and its comparatively wide-spread and thinly traded stocks—thinly traded by New York Stock Exchange standards, anyway.

When it came time to update the chart, however, I took a different approach.

Instead of hunting for illiquid underlying stocks and super-liquid ETFs, I went for the opposite. I cast around for an example of an ETF with thin volume, where the portfolio was small enough so that most investors could, if they wanted, just buy all the stocks themselves. Surely in such a case, the spreads of the liquid stocks would beat the spreads of the illiquid ETF, right?

Software was the perfect place to look, and IGV was our poster child. IGV is the iShares S&P North American Technology-Software Index Fund (NYSEArca: IGV). It holds 54 stocks, including some of the most liquid companies in the world, like Microsoft and Oracle. IGV, however, is a wee bit less liquid, trading less than 50,000 shares on an average day.

To see the full article, click here!

Errors Abound When It Comes to ETF Tracking Errors

Courtesy of Dave Nadig

Here’s how I know the ETF Revolution has long since passed, and what we’re living in now is the new ETF normal: The questions from advisors are getting a lot smarter.

I used to get emails about how creation and redemption worked. Now I get questions about tracking error.

Unfortunately, most people think about tracking error all wrong.

Here’s a perfect example. Take two funds that have been in the headlines a lot these past few weeks, the Vanguard MSCI Emerging Markets ETF (NYSEArca: VWO) and the iShares MSCI Emerging Markets Index Fund (NYSEArca: EEM).

Now imagine you’re a Sophisticated Investor. You know a few things: You know expense ratio matters. You know spreads matter. You know tracking error matters.

So you pop up your Bloomberg, and here’s what you see:


Even on trading, Vanguard wins on expenses. But Holy Meatballs Batman, what are those guys down in Pennsylvania doing!? A tracking error of 4.433 percent?

And at this point, many advisors will make a critical mistake, assuming that the Vanguard fund is horribly mismanaged. It’s not an unreasonable assumption, if in fact this was an accurate tracking error number. But it’s not.

Remember, academic tracking error is the annualized standard deviation of daily return differences. If the index is up 1 percent today, and VWO is up 0.95 percent, well, that’s -.05 percent to add to the series. Take that whole series, plug it into your stats package, get the standard deviation, annualize it, and there you go.

There are a few reasons this is all a terrible idea. First of all, imagine that VWO was actually missing its mark by 0.05 percent, day in and day out. Well, the standard deviation of those daily differences will be zero. It’s enormously consistent. Continue reading

Vanguard Drops MSCI..

Widely reported..and excuse our delayed tape i.e. dissemination.

Excerpt courtesy of IndexUniverse

Vanguard, the world’s biggest mutual fund company, has decided to segue away from some MSCI indexes over the next several months in favor of benchmarks created by FTSE. The move was motivated in part by lower index licensing costs and will involve its $67 billion Vanguard MSCI Emerging Markets ETF (NYSEArca: VWO).

Vanguard’s switch affects six international equity funds that had total assets of $170 billion as of Aug. 31, FTSE said today in a press release, noting the transaction was the largest ever international index-provider switch. The switch leaves iShares, the world’s biggest ETF firm, as the ETF firm with the deepest ties to MSCI.

The six funds will change to benchmarks in the FTSE Global Equity Index Series, replacing MSCI, and VWO and the index mutual fund of which it is part will be based on the FTSE Emerging Index, FTSE said. One huge difference is the absence of South Korea from the FTSE index, while the MSCI index weights the country at around 15 percent.

In its own press release, Vanguard said that in addition to the six international benchmarks moving to FTSE indexes, it also plans to switch indexes on 16 U.S. stock and balanced index funds to benchmarks developed by the University of Chicago’s Center for Research in Security Prices (CRSP)—a leading provider of research-quality, historical market data and returns. The existing indexes on these U.S.-focused funds are also provided by MSCI.

Full story: Click Here for IU update

ETFs Are Duking It Out Over Fees

By LIAM PLEVEN

Exchange-traded funds have lured many investors away from mutual funds by offering lower fees. But increasingly, some ETFs are also using fees to compete with other ETFs.

In a handful of high-profile cases, particularly in commodities and stocks, investors can choose between two ETFs that are virtually identical except for their fees. Gold bugs, for instance, can buy into a bar of bullion by holding shares in either SPDR Gold Shares GLD +3.88% or iShares Gold Trust IAU +3.94% . But the SPDR fund charges 0.4% of assets a year in fees, compared with the iShares fund’s 0.25%.

Disparities like that point to the rising importance of price as a distinguishing factor in what has become a crowded and confusing ETF marketplace for many individual investors. It isn’t clear yet how effective the tactic will be in the long run—there may be good reasons in some cases for investors to stick with or buy a higher-priced fund. But it seems to hold promise as a marketing tool.

ETF Fund Flow: Trumping Mutual Funds

According to technology and trading firm ConvergEx Group, during the first 6 weeks of 2012, more than $8 billion has flowed in to U.S. Equity ETFs, while nearly $8 billion has “flown out” of U.S. equity mutual funds.

“Some of the commentary surrounding these products has made them sound like the hoof beats which precede the Four Horsemen of the Apocalypse,”  said Nicholas Colas, ConvergEx’s Chief Market Strategiest, alluding to various critiques of ETFs that have emerged over the past 18 months, notably Kauffmann Foundation reports that blamed ETFs for a dead U.S. initial public offering market, and argued huge short interest in some funds could pose systemic risk.

“If you want to understand how investment capital flows play into the year-to-date rally for risk assets, the world of exchange-traded funds is essentially your ‘One Stop Shop,’” Colas said in the note, stressing that whatever negative comments are being made about ETFs, they are a great way to gauge overall sentiment in financial markets.

“But for 2012, you can just as accurately call them the most visible source of capital to help U.S. stocks and other risk assets higher,” Colas wrote.

Most Popular Funds

As far as the individual funds that have really “Killed it” in year-to-date asset gathering this year-to-date, Colas said the ETFs that have pulled in over $1 billion include:

  • iShares iBoxx $ High Yield Corporate Bond Fund (NYSEArca: HYG)
  • iShares MSCI Emerging Markets Index Fund (NYSEArca:EEM)
  • iShares Russell 2000 Fund (NYSEArca:IWM)
  • iShares $ Investment Grade Corporate Bond Fund (NYSEArca: LQD)
  • Vanguard MSCI Emerging Markets ETF (NYSEArca:VWO)
  • Powershares QQQ (NasdaqGM QQQ)
  • SPDR Barclays High Yield Bond ETF (NYSEArca: JNK)
  • SPDR Gold Trust (NYSEArca: GLD)

Apart from the strong push into U.S. equities, Colas said emerging markets and precious metals are coming back into favor, with inflows of $9.1 billion and $2 billion, respectively.

”We’ve noticed a trend now for at least a year where investors use country-specific funds in lieu of regional products,” Colas said, singling out a number of those funds that have gathered more than $100 million dollars in new investments since the start of the year.

Among those are:

  • iShares FTSE China 25 Index Fund (NYSEArca: FXI)
  • iShares MSCI China Index Fund (NYSEArca: MCHI)
  • iShares MSCI Germany Index Fund (NYSEArca: EWG)
  • Market Vectors Russia ETF (NYSEArca: RSX)
  • iShares MSCI Chile Index Fund (NYSEArcaECH).

“I have no doubt that mutual fund flows will eventually turn positive, and we’ll have to keep an eye on this trend when it develops,” Colas said.

“But for now, exchange traded funds look to be the horse pulling the market’s proverbial cart.”