Tag Archives: CNBC

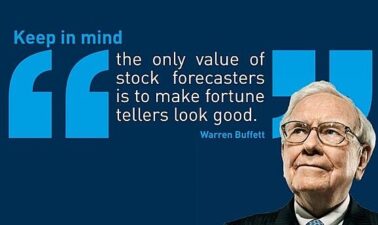
stock_forcaster-stock-market-pundits-2022-SPY-marketsmuse-warren-buffet

September Cycles & Stock Market Pundits

September (and October) are typically the most negative time periods for stock market investors, and to illustrate this seasonal pattern, this year is no different. And, stock market pundits are once again in the limelight.
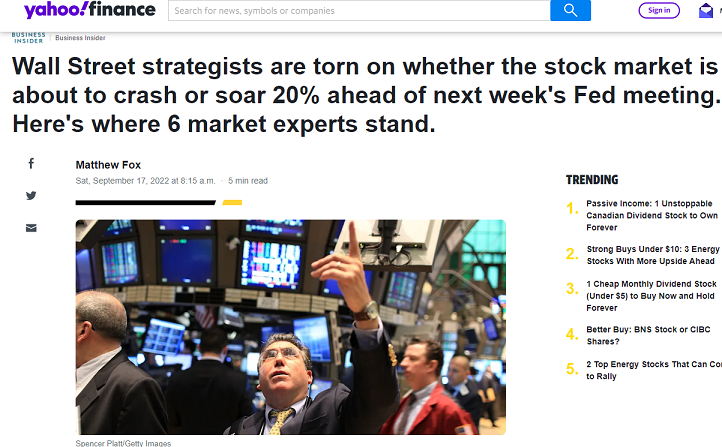
First, if you are a CNBC enthusiast, stop reading here. Our MarketsMuse team has voted unanimously for you to cut the chord if your investment horizon is longer than 1-4 days. The stock market pundits on that program are, for the most part, day traders whose holding period on a particular trade is shorter than the days you would keep milk in your ice box.

(Editor Note: THEIR DEFINITION OF “INVESTMENT” IS BASED ON ANNUALIZED RETURNS; if they can make 1% -2% inside of two or three days, the odds are you won’t get the memo that they took their profits and ran! The odds are greater still that any of those folks who appear daily will admit that they took a loss two days after their ‘pick’ plummeted by more than 5%.)

Second, if you do follow financial news headlines, you might already appreciate that every major investment bank, whether it be JP Morgan, Goldman Sachs, Morgan Stanley or Bank of America, has its own pundits whose internal views are diametrically opposed to each other. Why would you be a “High Networth Client” of any of these firms, when they can’t even agree internally on how to advise you?! Good question.

In June of this year, and then again in July, JP Morgan’s 66- year old Chairman & CEO Jamie Dimon, who is no novice when it comes to financial market assessments, was vociferous in his view that equities markets were facing a pending hurricane. Yet the same day in June that Dimon became a front page ‘bomb thrower’, his very highly-paid Chief Market Strategist Marco Kolanovick advised JP Morgan clients to “buy the dip”, as the 46-year-old ‘genius’ predicted US stocks (as measured by S&P 500) “will likely rally and close the year unchanged”.

At Bank of America, Chairman and CEO Brian Moynihan (62 years old) has remained an ardent bull throughout the ups and bigger downs of 2022, while his Chief Market Strategist has been as grizzly as an angry bear since the beginning of the year. Goldman Sachs’s top guns have leaned toward the less-than-optimistic view for most of the year, following the lead of its Chairman David Solomon. Morgan Stanley CEO James Gorman has been been a bull for much of the year, and his Chief Market Strategist, Mike Wilson has been pounding the bear table, as he had been since early 2021.

All of this proves that broken clocks can be right at some point.

So, what is an investor (and or a CNBC ‘short-term trader’) to do, knowing that September-October time sell-offs are the best advertised “upcoming crisis events” since long before Millenials were even born?

MarketsMuse has been following an assortment of stock market pundits, ‘technicians’, and global macro experts for months. The stock market pundits have reliably proven to be wrong, simply because most of them are employed by asset managers and investment banks whose primary purpose of existence is to sell investment products to confused investors. The notion of advising clients to “stay in cash until there is more clarity” is the last thing they would advise, until after the stock market has rebounded 25% from its lowest point. And in bear markets, that is precisely the time to lighten up, not to enter.

The chartists have proven prescient (with bearish medium-to-long term views, and while various global macro gurus have been somewhat blind-sided thanks to “not anticipating extent of Russia-Ukraine fiasco to “discounting what the Fed meant and what they heard the Fed say”. The global macro pundits who take into technical analysis along with the assortment of pillars within the global macro playbook have, for the most part, been telling you to be wary of buying stocks since the Fed went into QT (Quantitative Tightening) mode.

Lesson to be learned: NEVER FIGHT THE FED; regardless of what Jim Cramer spews.

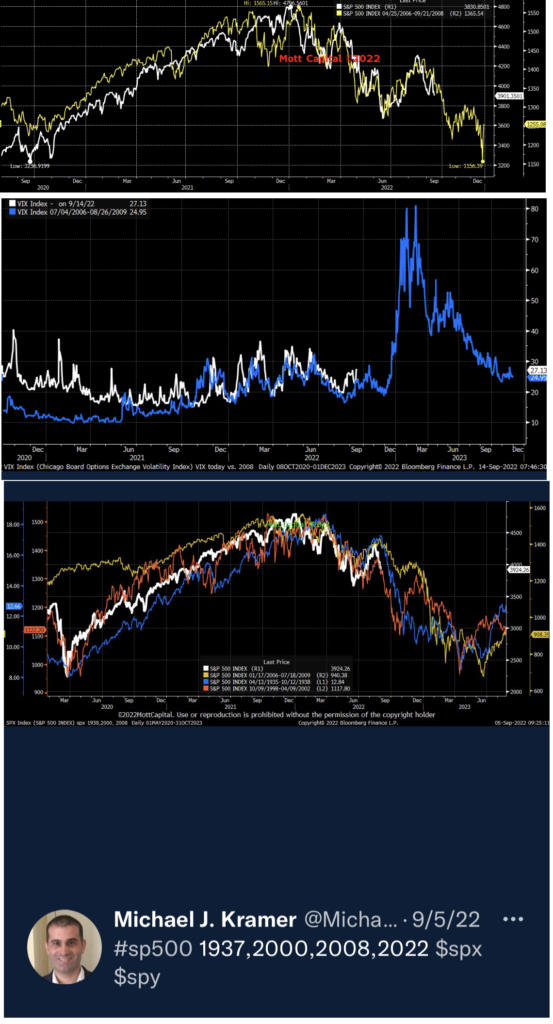
We can tell you that two of the more objective market experts that we’ve followed include Michael Kramer of Mott Capital and Neil Azous of Rareview Capital. Both of these 40-something students of financial markets have proven prescient throughout the year.

Kramer operates a relatively small hedge fund, yet is not beholden to bomb throwing and his humility factor is rare. While his equity-focused fund strategy is benchmarked to the S&P500 and that fund’s performance is still slightly negative on the year to date, his short-term trading calls have proven to be rock solid. Kramer is clearly a fan of all things technical, and his daily tweets and article posts on Seeking Alpha have made for great short and medium-term forecasts. Below are excerpts from charts that he has posted in recent weeks.
Rareview Capital’s Neil Azous layers his fundamental research (which incorporates rates, FX, energy, and geopolitical risk metrics) on top of technical charts. For example, in late April, after the S&P 500 had fallen from 4600 would to 4200, Azous sent a letter to a close-knit group of the world’s most sophisticated investors and warned of a fall down to 3600. Two weeks later, many (but not all) Wall Street analysts pivoted from bullish to bearish and bid on to Azous’s forecast. Azous then re-iterated his less than sanguine view in mid-May, suggesting S&P 500 (would likely go below 3400 before the worst was over).

Throughout the year, Bridgewater Capital’s Ray Dalio, viewed as one of a unique breed of global macro thought-leaders) has been an outspoken bear, even if it took him until recently to ballast his firm’s exposure to Chinese equities. While Wall Street stock market pundits have been pushing the buy the dip strategy, Dalio’s Bridgewater has reported 30% gains on investments. He’s still a bear; Dalio suspects the next 10 years will fall into the category of “another lost decade”.

From a historical perspective (yes, Matilda, history does it repeat itself!), and taking into account 2022 stock investors have suffered their worst start to a year since 1970, consider the following factoids that we sourced from across the ethernet:

  • According to APNews, bear markets since World War II have taken an average of 13 months to go from peak to trough, whereas the average time for the stock market to recover stands at 27 month
  • Forbes 08-24-22*  “In fact, the average length of a bear market for the S&P 500 is just 289 days. That’s not a typo. Just over 9 months and the average bear market is done. Finished. Not only that, but once the market turns around, the average bull market runs for 991 days or 2.7 years. Not a bad deal for investors. The bear market in the S&P 500 was confirmed on June 13th, 2022, but the market began its slide on January 3rd 2022. With this date as the start of the current official bear market, the average bear market of 289 days means that it would finish on the 19th of October 2022.
  • So there you go, the bear market will end, based on the historical average, in the Fall and the good times will be back by Christmas. * https://www.forbes.com/sites/qai/2022/08/24/the-average-bear-market-lasts-289-days-how-long-do-we-have-left/?sh=66f6e5245d5d
  • Raymond James’ historical performance of the S&P 500 Index throughout from `1926 through March 2017. The average Bear Market period lasted 1.4 years with an average cumulative loss of -41%.
  • Felix Richter / Statista.com June 2022  https://www.statista.com/chart/27616/length-and-depth-of-the-latest-s-p-500-bear-markets/bear Bear markets are not an everyday occurrence, thankfully, with the latest one being just the fourth in the 21st century. Looking at past bear markets all the way back to the 1970s indicates that things could very well get worse before they get better. In the previous seven bear markets, the S&P 500 dropped by an average of 38 percent before turning around and it often took years before the index had recovered all of its losses and returned to its previous peak.
  • Across the 10 bear markets since 1950, the longest was 929 days and the shortest was 33 days. Since 2000, there have been only three bear markets not including this one. One of those was history’s shortest; Bear markets, even the long ones, have always given way to bull markets
  • 1973-1974  48% decline, 69 months to break even..
  • 1980- 20 months; then 3 months to break even
  • 2008- 50% decline and two years to break even
  • S&P 500 bear markets since 1946 have taken an average of 389 calendar days to bottom, and then another two years to return to their prior high.
  • We are currently experiencing the 22nd bear market since 1929
  • The average loss of bear markets to reach the bottom before turning back up since 1929;  37%, Median 33.5%
  • The average length of a bear market is 344 days, median of 240 days (best case 2 years, outside 3 years)
  • 1990 bear market lasted 31 months
  • Nine of the 12 bear markets since 1948 have been accompanied by recessions, according to investment research firm CFRA
  • From peak Dec 1972, it took 8 years and 8 months  (to July 1980) for SP500 to achieve break even. Then it rallied 25% over the next 2 years, then fell 30% over the following two years into Aug 1983; not returning to a high point until January 1985
  • 2000-2007 was the lost decade.  Let’s not forget 2008-2013; prices peaked in late 2007, and did not achieve ‘break even’ until April 2013… Slightly higher (before adjusting for inflation) vs SP high of 2000.  So that’s actually a lost decade and ½.
  • According to investment analysis firm Seeking Alpha, the average duration of an S&P 500 bear market since the 1920s has been 289 days or about nine and half months. (The shortest, in March 2020, during the onset of the COVID-19 pandemic in the US, lasted just one month.) On average, the S&P 500 declined about 36% during those bear periods. 
  • But more recently, the 14 bear markets since World War II have averaged 359 days, or close to a year, according to Bespoke Investment Group.
  • Analyzing all the bear markets since World War II, Ben Carlson of Ritholtz Wealth Management found it took 12 months to go from “peak to trough,” or from the end of a period of growth to hitting rock bottom. That means the current bear market would bottom out at the beginning of 2023, a year after January’s peak.
  • Jan 2022, famed chartist Larry Williams predicted a series of declines and rallies, yet argued S&P500 would close the year higher. Yikes.
  • One of the shortest bear markets: Feb 2020 to Aug 2020, it took only 9 months to break even (more precisely, the shortest bear market in recent history Jan 2020 to Oct 2020 (pandemic era, the QE era with near-zero interest rates)
  • 2016 A recent study from Oxford University found that “returns on stocks with the most optimistic analyst long-term earnings growth forecasts are substantially lower than those for stocks with the most pessimistic forecasts.” In other words, your investment portfolio would be better off if you did the exact opposite of what most Wall Street analysts advise.

If you have a comment, a contribution or a tip, please reach out to us

hft-high-frequency-trading-firms-pr-crisis

Stock Price Implosion Puts HFT Firms Under Attack, Again

Stock Price Implosion Leads Some to Challenge Current Market Structure; HFT Firms Are Under Attack, Again…

Heads Up to High-Frequency Firms: Time to Hire a PR Crisis Manager Again, Call Your Lobbyists, Book Your Plane Tickets to Washington DC.

Before “bidding on” to the anti-HFT and anti-ETF remarks circulated by the assortment of market pundits appearing on Bloomberg, Reuters or the financial media megaphone channel, CNBC, you should know that SecTres Mnunchin has already weighed in. So has the SEC’s favorite tech entrepreneur, Mark Cuban. So has icon stock investor Leon Cooperman, who has the ear of Mnuchin and others. There’s a whole ‘hang-em-high’ crowd assembling to lay blame on high-frequency trading for the latest market routs. According to CNBC, Trump favorite Mike Flynn was overheard shouting to Mnuchin and Trump: “Lock them up!”

citadel-nyse-dmm-hft
NYSE DMM Citadel Securities started as a HFT prop trading firm

But, unless you’ve been investing in or trading in the equities markets for at least 20 years, you probably have no conception of a simple premise: markets go up and markets go down. Blame games are easy to play, equities investing is not always easy.

Traditional drivers to stock price movements include simple, time-tested fundamentals: the interest rate environment, the economic cycle, the value of the US dollar vs. other currencies, corporate revenue and profit, corporate debt levels, consumer debt levels, trends in residential real estate prices and other consumer optimism metrics. Yes, you can throw in the degree of confidence in the current government administration and a bunch of other geopolitical stuff (including tariff wars, Brexit event, and total uncertainty in many countries’ leadership–including the US) into the mix. We’ve all grown accustomed to the minute-to-minute chaos caused by the current president. His impact on stock prices is powered by his Twitter comments about China, the Federal Reserve Chairman, and blaming the latest government shutdown on democrats. Beyond that, institutional investors can only make investment decisions based on reality within context of  company earnings reports and not easily-fudged economic data. Investors should NOT make decisions based on a reality TV show produced in Foggy Bottom.

But, we should agree on one thing: the combination of complacent investing, a belief that prices of company shares will go up year after year is a fool’s view. The topic of debate in this post is whether the evolution of high-frequency trading (aka HFT) weaponry has contributed (yet again) to the large (downward) percentage moves in stock prices during the recent weeks. The sell-off, which arguably began during the first week of October, has led to an approximate 20% decline in the leading stock indices from the record highs. Many individual share prices have suffered bigger mark-downs, most notably tech sector stocks. Before asserting that high-frequency trading algorithms are the culprit, one need to ponder whether those same HFT tools also contributed to the nearly 50% gains the stock market has enjoyed since the 2016 US presidential election (two years ago)?

Whatever black swans have been flying over head for the past 6 months, now that equity prices have suffered multiple-day declines of 1%-3% (and the interim 1%-2% “dead cat bounce”) we need to blame someone!! After all, our very own president has been unwavering in his leadership mantra: “When the shit hits the fan, blame someone else for the problem!”

Let’s say you want to blame HFT firms for the slide. Considering the fact that today, the 3 largest NYSE market-makers are better known

virtu-nyse-dmm-hft
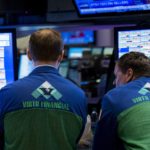
Specialist traders work at a Virtu Financial booth on the floor of the New York Stock Exchange April 16, 2015. Shares of electronic trading firm Virtu Financial Inc rose as much as 24.6 percent during their IPO, valuing the company at about $3.23 billion. REUTERS/Brendan McDermid – RTR4XMJS

for their legacy as high-frequency trading outfits, its easy to be cynical. These are ‘not your father’s NYSE specialist firm’, these are young quant jocks who made a ton of money as HFT prop trading shops starting back in the early 2000’s, and more recently, used some of that cash to purchase the legacy NYSE market-maker firms; the firms responsible for maintaining fair and orderly markets in NYSE listed companies. Now known as NYSE “DMMs”, they (actually their computers) also have the “first look” at orders to trade shares in which they are now the designated market-maker for. Instead of old-fashioned auction markets, these folks utilize algorithmic trading tools to match buyers and sellers and also trade for themselves. As a consequence, there is circumstantial evidence these firms are, to some extent, culpable for the rapid reflex moves in share prices.

Keep in mind, the flip-side is that these ‘HFT black boxes’ are also providing instantaneous liquidity, price transparency, and facilitate exiting or entering a investment position in less time than it takes to hit a ‘send’ button (until someone unplugs the machine after realizing they’ve risked the entire firm’s capital). Further, because everything happens in nano-seconds, one can argue that bear market cycles –periods that typically reflect recessionary pressures and in turn, signals that lead to a negative impact on the value of a company’s equity shares—are now much shorter in duration when compared to cycles going back 60-70 years.

To the first question, who can forget the May 2010 ‘Flash Crash’—an event that was certainly connected to HFT computers plugged into the walls surrounding the NYSE and NASDAQ computer server farms–and then became unplugged by humans when markets cratered due to a “fat finger” episode. We’ll tell you who cannot remember that event (other than having read about it years later): upwards of 1/3 of current ‘senior’ Wall Street quant jock HFT programmers who code the HFT machinery. Many of them were mining bitcoins in their MIT dorm rooms back in 2010. How many of the current generation of ‘systematic traders’ who now oversee billions of dollars were beyond high school in 2004? How many current trading desk wonks were around during the dot com bubble? How many folks who worked on trading desks in 1987 are even still alive, no less working in the business? Have you gotten the point, yet?

Because our pundits have accurately predicted this latest market down draft, allow us to further predict that we want to be “long on” private jet services to Washington (NYSE: BRK.A) and we’d love to invest in engagement contracts issued by PR Crisis Management gurus who represent these folks; they are presumably getting calls already by the best-known HFT honchos, starting yesterday.

Let’s be clear, the fundamental economic underpinnings that power equity prices have been sending mixed (warning) signals for months. OK, employment figures have been good, but Trump told us while campaigning for president that “US Employment figures are fake and fraudulent.” Yes, corporate earnings have met expectations, but nobody has delivered out-sized reports, and many companies have been sweating to provide realistic expectations, not wild-ass projections. According to recent polls, nearly 50% of Fortune CFOs are anticipating a recession will hit the US economy in 2019. 80% of CFOs believe a recession will be upon us before the end of 2020. Many multi-nationals based in the US are lamenting “Tariff Man” tweets. He says ‘US companies with US employees that make/sell products to US consumers will benefit, and the big companies have plenty of money to cushion the blows..” Really?!

So, fundamentals have been weakening during the past 2 quarters (unemployment figures aside). Even for those who subscribe to technical analysis and historic charts, the writing has been on the wall for months: “Caution Mr. Robinson, Caution!”

High-flying tech company shares started cracking in the 2nd quarter of 2018. They’ve been under an assortment of pressures that range from severe government and shareholder scrutiny to simple supply/demand obstacles impacting their business models (e.g. FB down nearly 40%, GOOG down 30% from its high, AAPL down 40%, AMZN down etc etc.) Bank stocks have been pummeled for the most part, even if GS’s latest beating is connected to yet another multi-billion dollar scandal. Big ticket corporate acquisitions made in the past 2 years have resulted in transition management problems. Corporate balance sheets have become increasingly overly-bloated with debt, thanks to folks on Wall Street who came up with a new pitch to corporate treasurers starting back in 2011: “We’ll float your bond offering (and get a big fee), you use the proceeds to repurchase outstanding shares, and you’ll make your EPS numbers look fantastic; everyone wins!!” Until the music stops, of course.  Corporate share repurchases have been credited with keeping equity prices stable and moving higher for upwards of seven years; the brokers are making nice commission on executing those buybacks and all is good with the world, until its not.

Stock market chartists started raising red flags in October. Corporate debt issuance came to a crashing stop in the last 6-8 weeks. That was a big signal. Less than two dozen Fortune companies have actually been buying back debt in the past quarter in preparation for the next shoe to drop; the one with the word ‘recession’ stamped on the bottom of each shoe. The notion that corporations should unwind the ‘sell debt, buy shares’ trade –by issuing new shares and using the proceeds to balance the balance sheet and repurchase outstanding debt is an idea that no investment bank would even suggest in his sleep, no less in an office. It would be professional suicide for a corporate CFO to even suggest that idea makes sense. Geopolitical impact re Trump’s tariff war is hitting US companies and US workers, even if not the Trump Hotel enterprise. The corporate tax cut was a short shot of heroin that stimulated the stock market, but increased the Federal deficit by nearly $1trillion. (Let’s not forget that Trump campaigned on reducing debt, not increasing it–but so does every other candidate). Now people are coming off the sugar high and that’s how/why stock prices revert to the mean.

Tariff Wars, Brexit and the assortment of geopolitical catastrophes have all been thrown into the mixing bowl. Crude oil prices have been crushed–along with the share prices of companies that drill, process and sell oil-based products. Yes, we’ll repeat: employment figures have been great, but as Donald Trump said throughout his presidential campaign, “Nobody can believe government employment figures, they’re all fake news!”

When weighing the assortment of fundamental signals that have been brightly broadcast throughout the past 9-12 months—and certainly since October of this year, anyone who had not re-balanced or pared down exposure to equities has no business investing in stocks. Its easy to say “Ok, 20-20 hindsight is great..blah blah blah..” For those following @marketsmuse, there’s no 20-20 hindsight; our resident pundits (with trading market pedigrees that go back to the 1980’s) have been shouting “Caution Ahead!!” for at least 4 months. (see the pinned tweet).  But, who wants to listen to experienced (if not cynical) professionals who have lived through multiple market cycles, especially when prices keep going up? Who wants to risk taking a profit and paying taxes on those gains when the asset value keeps going up, with or without fundamental justification? The answer: people who are (i) naïve (ii) overly-optimistic (iii) financially irresponsible (iv) not old enough to appreciate that what goes up, must go down.

Whatever black swans have been flying over head for the past 6 months, now that equity prices have suffered multiple-day declines of 1%-3% (and the interim 1%-2% “dead cat bounce”) we need to blame someone!! After all, our very own president has been unwavering in his leadership mantra: “When the shit hits the fan, blame someone else for the problem!”

Before the ink was dry on the famous Michael Lewis book “Flash Boys,” which profiled the May 2010 stock market crash, everyone knew who to blame. Before the first 1000 copies of that book left Barnes & Noble, government officials and regulators were busy sending out outlook meeting invites to the primary suspects-the heads of HFT proprietary trading firms that had come to dominate the trading of shares in US companies listed on public exchanges (and ‘dark venues), as well as stock index futures traded on electronic venues in Chicago.

Rules were introduced. Market structure lobbying groups were formed. Exchange executives pilot tested uptick rule changes. Fintech firms that provided ‘better solutions’ now represent more than just a cottage industry as evidenced by the fact, three of the leading HFT firms have through acquisition, become the three largest NYSE DMMs. For old folks, DMM is the contemporary phrase for ‘floor specialist’-the folks who are responsible for maintaining fair and orderly markets in the companies the NYSE assigns to market-makers on the floor of the NYSE. Pay-to-play and maker-taker rebate schemes advanced by brokers and exchange venues have flourished. Blah Blah Blah. Along the way, the US equities market, spurred by improving economic circumstances, and the last 10 years have been pretty much one long wet dream for traders and stock investors. The evolution of high-frequency trading morphed even more.

Irrespective of bull vs. bear views on individual stocks and stock indices and the 1500+ Exchange-Traded Funds that provide thematic investing styles, more than a carload of institutional investment managers still agree on one simple fact:  share price movements in individual companies and ETFs are exacerbated by high-powered black boxes that spit out millions of orders per minute. Those orders are often based on what has transpired in the markets during the past few seconds. This algorithmic approach to trading causes educated investors to scratch their heads when observing the value of shares in public companies can gyrate so violently in the course of an hour or a day, despite the fact those companies haven’t made any earnings report nor announced any positive or negative news as to the health of their business or the industry they sit in.

How does a company’s enterprise value move 10% down one day, then 5% up the next? Are there so many investors with differing views who are expressing these views constantly via buying and selling millions of shares? No. Honest electronic trading industry experts will estimate that at least 80% of the time, transactions taking place at the NYSE or NASDAQ are between two ‘transformers’; computer bots that are set on auto-trade. These black box powered bots do not represent investors, they don’t smoke (unless the computer is overheated and not residing in a freezer), they don’t curse and they don’t sweat—they simply spit out–orders based on algorithms.

Put more simply, actual investors are not involved in upwards of 90% of the trades taking place. Bottom line: the exaggerated changes in publicly traded corporate enterprise values that take place from second to second are even more pronounced as prices move lower. That’s a real fact, not a Kelly Ann Conway or Sarah Huckabee-style “alternative fact.” More than a handful of objective market observers and participants have long argued that Wall Street has evolved into a Battle of the Transformers”; price moves and volatility are powered by computers, not by momentary sentiment changes on the part of real investors.

But, we live in a blame game world, as best evidenced by our so-called leaders (yes, we’re referring to the current occupant of the White House) who, when faced with obstacles or after making stupid decisions, automatically blame others for the disaster that occurred recently.  And those blames are applauded by the blind mice and sheep who go along with the stupid decisions made for them.

Because our pundits have accurately predicted this latest market down draft, allow us to further predict that we want to be “long on” private jet services to Washington (NYSE: BRK.A) and we’d love to invest in engagement contracts issued by Wall Street-friendly PR Crisis Management guru. Those folks will be on speed dial for the best-known HFT honchos, starting yesterday.  Caveat Emptor: PR crisis management should be advanced by smart folks, not those trained in the art of jibber jabber and deflection. If there is a fundamental flaw, acknowledge it and implement transparent steps that will appease the plaintiffs and provide real solutions to the ‘problem’ .

If you’ve got a hot insider tip, a bright idea, or if you’d like to get visibility for your brand through MarketsMuse via subliminal content marketing, advertorial, blatant shout-out, spotlight article, news release etc., please reach out to our Senior Editor via cmo@marketsmuse.com

investors-impaired-rareview

Professional Investors Are Impaired Says MarketsMuse

Referring to anyone as ‘being impaired’ is not a compliment. And, in the world of financial market punditry, where at least half of the experts are best at telling their audience what happened during the past 12 hours, while another 45% who position themselves as forecasters are right maybe 50% of the time, its no surprise that some industry experts would go as far as to suggest that most professional investors are impaired. MarketsMuse curators liken that phrase to the ‘professionals’ in Washington DC (as well as nearly all state capitals) who are playing at the game of politics. For those who keep a scorecard and track the performance of forward-looking views regarding financial markets and expressed by those appearing on the assortment of business news outlets, the following clip courtesy of CNBC might be looked back upon by viewers with the thought, “this guy really does has sight beyond sight!”


dealindex crowdfund industry

CNBC Trumps Bloomberg In Crowdfund Industry Indices

(RaiseMoney.com) The Equity Crowdfund Industry continues to go mainstream, as evidenced by this week’s market data and index intel pact signed between business news platform CNBC and DealIndex, a self-described “global deal and data aggregator for the best crowdfunding opportunities.”  The deal will have the two firms launching four equity crowdfunding indices that provide metrics on top equity crowdfund deals from around the globe. Last month Bloomberg LP announced it had formed a pact with Orchard Partners to distribute Orchard US Consumer Marketplace Lending Index, a direct lending (aka peer-to-peer lending) index of marketplace loans.

Equity crowdfunding, which has been a sweet spot for MarketsMuse curators is expected to create more than $4bil in funded deals for startups and fast-growth companies. Booming investments in real estate are leading the way among equity-crowdfunded projects, which rose to $662 million in the first quarter of 2015, a big jump from the $483 million recorded in the final quarter of 2014.

“Equity crowdfunding is going to double every year as more and more investors get to know about it,” said Eric Smith, director of data analytics at Crowdnetic, an online platform that tracks equity investments in real-time and just published the equity-crowdfunding data in its new quarterly report.

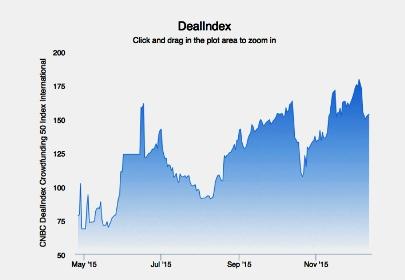
In partnership with CNBC, DealIndex announced the launch of four crowdfunding indices: International 50 Index, UK 50 Index, Technology Index, and the International Aggregate Index. The indices take transparency in the crowdfunding industry to a new level by aggregating information on the private fundraising sector into usable and easy-to-understand benchmarks. The indices track the pulse of the alternative finance market, providing a real-time indicator of market activity.

According to one highly-reliable MarketsMuse source, “The race for crowdfund industry data and metrics is only beginning. The fact that CNBC, which most financial industry professionals view as the ‘Cartoon Channel’ when compared to the likes of Bloomberg LP, could certainly add a new silo for the CNBC programming lineup, as the crowdfund industry is expected to soon surpass the grey beard venture capital industry in terms of money raised for innovative startups.

For the entire story, please click here

NYSE Snafu Causes Market Structure Experts to Flip-Flop

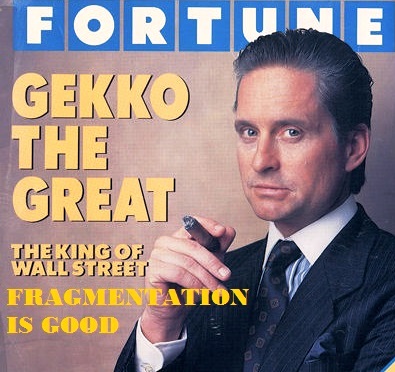
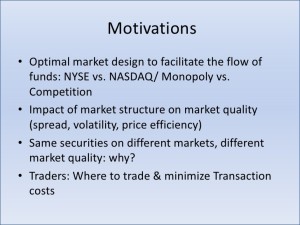
MarketsMuse senior editors have quickly canvassed a broad assortment of “market structure experts” and industry talking heads who have been at the forefront of debating the pros and cons of market electronification, multiple market centers and the underlying issue: “Is Market Fragmentation Good, Bad or Ugly?”

For those who might have just landed on Planet Earth, the debate (which is ongoing via industry outlets such as TabbForum, MarketsMedia, and most others) boils down to whether multiple, competing electronic exchange systems enhance overall market liquidity and make it ‘easier and better’ for institutions and retail investors to execute ‘anywhere/anytime’ via the now nearly two dozen “ECNs”, “Dark Pools” that offer a Chinese menu of rebates, kickbacks and assorted maker-taker fee schemes (e.g. ARCA, BATS etc), or whether someone should try to shove the Genie back into the bottle and revert to the days of yore when the NYSE was the dominant listing and trading center for top company shares, and complemented by a select, handful of regional stock exchanges, most notably, The MidWest Stock Exchange, The American Stock Exchange, The Philadelphia Stock and the Cincinnati Stock Exchange.

Despite the fact that CNBC talking heads dedicated the entire day’s coverage to the NYSE snafu with rampant speculation as to whether the day’s outage was due to a cyber attack by the Chinese in their effort to distract the world from the dramatic drop in China-listed shares, whether it was a Russia-based malware attack, or perhaps even an ISIS-born cyber-terrorist attack that also impacted United Airlines)–the fact of the matter (one that CNBC seemed oblivious to) is that those who wanted to execute stock trades through their brokers were able to do so without disruption, simply because those brokers routed orders to a drop down menu of exchanges that compete with the NYSE..

Yes, the NYSE lost a day’s worth of fees attached to every order they typically execute on a normal day (not a good day for exchange President Tom Farley)–but more than half of the market structure experts who have continued to campaign against market fragmentation have [temporarily] flip-flopped today and have acknowledged that were it not for multiple competing exchanges, today would have been a real headache for US stock market investors and brokers. No doubt CNBC and others who were fixated on this outage will be able to turn their attention back to what is taking place in Greece, China and other topics that actually do impact the price of global equities.

ETF Investors Look For Success Outside The US

MarketsMuse blog update is courtesy of CNBC’s Jeff Cox. As we have seen so far this year, ETFs have been becoming increasingly popular among all investors. MarketsMuse blog update profiles the biggest trends in ETF investing, including investing in international currencies. An excerpt from CNBC’s Jeff Cox’s article, “Hottest ETFs are currency hedges, non-US funds” is below. 

Exchange-traded funds have surged in popularity in 2015, but it’s not U.S. equities that are leading the charge.

Investors poured $97.2 billion into various ETFs and other similar products in the first quarter, marking the $2.9 trillion industry’s biggest start ever despite a wobbly U.S. stock market and a testy geopolitical climate, according to data from BlackRock, the world’s largest provider of such funds. (U.S.-based ETFs have about $2.1 trillion in assets.)

There essentially have been three major investment themes this year, and players in the exchange-traded market have made each work: A quest for investment themes outside the U.S.; the offshoot of that, which has seen domestic attention turn away from large caps and toward mid- and small-sized companies, and capitalizing on the big moves in currency markets, particularly an appreciation of the U.S. dollar and the decline of its global competitors. The greenback has gained 7 percent so far against a trade-weighted basket of other leading currencies.

Some $59 billion has found its way into products that focus on currency hedging, according to ETF.com, which said the group represented four or the top 10 funds for investor flows during the first three months of the year.

To read the rest of the article on ETF investment trends from CNBC, click here.

Hedged Vs. Unhedged International Currency ETFs

MarketMuse blog update courtesy of CNBC. With investing overseas being so dangerous right now, because of enormous moves in currency, buying stocks overseas—including ETFs, why are people so keen on doing it. CNBC reporter, Bob Pisani’s ask the question:

Why doesn’t everyone buy hedged international ETFs when they want international exposure, rather than unhedged ETFs?

There are several reasons:

1) Until recently, it was almost impossible for the average investor to do so. There simply were no ETFs that enabled an investor to hedge out currency. A professional could hedge, of course, but at considerable cost.

Now that more hedged ETF products are becoming available, investors are taking note. In fact, the biggest European ETF is now a hedged product, the WisdomTree International Hedged, which recently surpassed its biggest unhedged rival, the Vanguard European ETF.

2) There was not a huge demand for such a product because currency moves like we have seen in euro this year (down 5 percent against the dollar) are very rare. Oh sure, maybe if you were investing in Argentina, but not the euro, not the yen. Most years did not involve anywhere near such dramatic moves.

This year, for example, the yen has barely moved against the dollar, so the difference between a hedged Japan ETF and an unhedged Japan ETF is very small:

That was not the case last year, when there was an enormous move in the yen versus the dollar, and investors made the DXJ the hottest ETF in years.

For the entire article from CNBC’s Bob Pisani’s story “Why currency-hedged ETFs are hot”, click here.

Should You Have An All-ETF Portfolio? Betterment CEO Has An Answer

MarketMuse update is courtesy of CNBC. CEO and Founder of Betterment , Jon Stein, offered his commentary on this issue to CNBC. Betterment is an automated investing service that provides optimized investment returns for individual, IRA, Roth IRA & rollover 401(k) accounts.

There’s a natural progression in the way the public responds to innovation. Something that first seems like a mere novelty becomes an interesting new niche, then a great idea and then, “How did we ever get along without this?”

In financial services, exchange-traded funds are somewhere around the third or fourth stage, between new niche and great idea. ETFs attracted more net investment last year ($239 billion) than did mutual funds ($225 billion), according to data from Morningstar. Five years earlier the net inflow into mutual funds was more than triple the net amount invested in ETFs.

In the last five years, the public’s affinity for ETFs raised assets under ETF management by 152 percent, to $2 trillion, up from $793 billion. Mutual fund assets only rose 53 percent during the same period.

Faster and cheaper information system infrastructure has helped the growth of ETFs. In my view, ETF portfolios will be the inevitable default for investors in the years to come because they are lower cost, more transparent and offer greater liquidity and tax advantages than mutual funds. Already, the increasing number of assets invested with automated investing services, which use all-ETF portfolios, underscores this shift.

Lower cost

By passively and systematically tracking an index, ETFs are far cheaper to run than most actively managed mutual funds that employ portfolio managers and analysts to select securities. That research costs money, and so does the frequent trading that’s common in such funds—they call it “active management” for a reason—not to mention the buying and selling of fund shares themselves, transactions that always involve the fund provider.

More transparent

ETFs also feature greater transparency. Their underlying portfolios change more rarely because the indexes that they’re based on generally maintain stable lists of components. The high turnover of many mutual funds and the fact that their holdings are reported only four times a year can make it difficult for shareholders to know exactly what they’re holding.

It’s not just the specific securities that can keep mutual fund investors in the dark. The broad nature of the fund itself can become obscured by what’s called “style drift.” Say growth is outperforming value; the managers of value funds, consciously or not, may start tilting toward more growth-oriented stocks.

Depending on what else they own, shareholders may become overweight in growth stocks and not even know it. By contrast, a value-stock ETF will hold value stocks no matter what.

ETFs are more transparent in another sense. The very low expenses and commoditized nature of ETFs make commissions and “kickbacks” to brokers or retirement-plan sponsors impractical. So if an ETF is recommended by an advisor or made available by a broker or retirement-plan sponsor, it’s likely to be an unbiased recommendation.

For the complete article from CNBC, click here

In Your Face: Option Trading Contrarian Called $FB Move re: post-lockup activity

     Courtesy of John Carney/CNBC

MarketsMuse Editor Note: article below was published Tuesday Nov 13 at 6pm, in advance of $FB lock-up  expiration.

Eight hundred million shares of Facebookare set to “flood” the market Wednesday, as the company’s biggest post-IPO lockup expires.

This has many investors fearful that stock sales from employees could push the stock, which has lost nearly half its value since the IPO, even lower. Some are calling it the “Facebook fiscal cliff.” (Read more: Facebook Drops as Employees Sell Shares)

But not everyone sees this as a reason to sell. In fact, some contrarians think it will be an excellent time to buy Facebook.

Matt Gohd, a senior managing director and options strategist at WallachBeth Capital, thinks Facebook [FB  21.5592    1.6992  (+8.56%)   ] stock could very likely go up in the aftermath of the lockup expiration.

“I think it could go up tomorrow, it will be up next week, and it will be up at the end of the month,” Gohd said.

Gohd’s thesis is pure contrarianism. With so many traders positioning themselves for a downward move in Facebook stock, the stock price may have already incorporated the coming sales. If you believe markets are at all efficient, certainly they should have priced in the shares coming out of lockup.

“The end of the lockup is the worst-kept surprise in U.S. history,” Gohd says.

When the first lockup of Facebook shares was lifted on August 16, shares fell 6.3 percent. But if you bought shares at the closing price on August 16 and held them for a month, you saw an 8.3 percent gain.

I should point out that Gohd pointed out in early August that the lockup expiration could be bullish for the stock

Facebook shares were flat the first trading day following the lockup expiration on October 15. If you bought at the closing price that day, you’ve seen a 2.18 percent gain to date. (And you were up by a nudge more than 19 percent on October 24.) Continue reading