If the second shoe is actually falling as US (and all other) equities markets appear to indicate this morning, MarketsMuse ETF and Global Macro editors were stimulated by having Sight Beyond Sight with this morning’s coffee, courtesy of Rareview Macro’s Neil Azous. Of particular interest, Azous points to Mebane Faber’s The Ivy Portfolio for those who have defaulted to using exchange-traded funds and to the reference to Occam’s Razor, a principle that global macro enthusiasts will appreciate.
Without further ado, please find an extract from this morning’s edition of Sight Beyond Sight…
Corporate Buybacks Not Strong Enough to Save Stocks Today…Retest of the Lows Now Underway
- Negative Statistical Analogs
- No September First of the Month Inflows
- China Quantitative Tightening (QT)
- Trends Switch to Medium- from Short-Term
- Correlation Breakdown

The key takeaways to start September are invisible to the naked eye; a little sight beyond sight is required this morning in order to see them clearly.
Firstly, we are not sure who the source was, but the following S&P 500 analog was sent to us:
In the 11 times the S&P 500 fell by more than 5% in August it declined in 80% of the subsequent Septembers; the average decline in September in those years was 4%.Now, there are many statistics with similar odds of success being circulated out there, but in aggregate these one-liners miss the bigger picture, in our opinion.
The message is that the higher volatility witnessed during August has carried over into September. It took eight hours of the overnight session for S&P futures (ESU5) to confirm 65% of the above analog, as the index was -2.6% at one point.
Secondly, the first of the month inflows into risk assets that professionals are accustomed to relying on to support their long equity positions has gone missing this year. Inflows into equities are generally expected to follow the simultaneous release of PMI manufacturing data, especially when the data historically points to a stronger global growth profile. However, the data released this morning was uniformly weak, and serves as a reminder of the regional synchronicity – that is, Japan’s consumption-led recovery is faltering, the US has a second half of the year inventory overhang to work through, Europe’s inflation profile is reverting back to pre-“QECB” profile, and China remains an unknown.
Thirdly, given the overall weakness in risk assets the sell-off in the German Bund (RXU5) over the last 24-hours is confounding professionals. Occam’s Razor, a principle that states that among competing hypotheses that predict equally well, the one with the fewest assumptions should be selected, suggests that the Chinese central bank is once again selling dollars and foreign fixed income reserves to buy yuan. As a reminder, FX intervention means foreign reserves have to shrink. The mechanics are as follows: sell foreign sovereign bonds > receive US dollars (USD), euro (EUR), yen (JPY) > use USD/EUR/JPY proceeds to buy CNY = no impact to private economy.
The Chinese Yuan, both the onshore (USD/CNY) and offshore (USD/CNH) versions, is trading at its strongest level since the devaluation. The key difference today however is that the central bank is not defending yuan weakness. Instead, in the spirit of managing volatility, it appears it is proactively reminding speculators who their daddy is and doing a good job of crushing their souls at the same time.
Next..
As a reminder, in the August 23rd Special Sunday Night edition of Sight Beyond Sight we wrote the following:
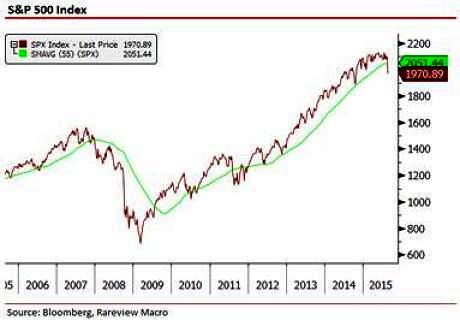
The most important metric we are now looking at is the 55-week moving average (WMAVG). Why? Because a one-year time frame helps smooth out the noise and separates the “daily” from “weekly” indicators for us.
Every time this “yearly” metric rolled over since 2011 when it began its uptrend it was never able to sustain the downside for more than one period. In fact, the same can virtually be said about all equity related charts beyond a “daily” period.
We are watching very carefully for the 55-WMAVG to show a deterioration for two periods in a row. At the same time, we are mindful that it is transitioning to a downward sloping path after being in the same upward trajectory since 2011.
If the weakness holds over two-weekly periods it will remove any debate over near-term or “daily” readings as the market psychology changes to the medium-term and the possibility of a whole new US equity regime. (SEE FEATURED IMAGE ABOVE)
Here is where the new month becomes, in our opinion, a lot more interesting.
Before we begin please note that we cannot take credit for this work or observation. It comes from the Scott’s Investments Blog, a blog this private citizen uses to consolidate free online investment resources and strategies, and which he finds very useful.
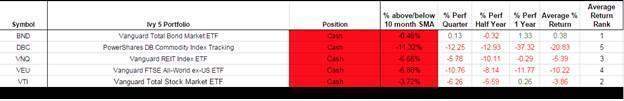
To illustrate our point see the below Ivy Portfolio spreadsheet that tracks the 10-month moving average signals for two portfolios listed in Mebane Faber’s book The Ivy Portfolio: How to Invest Like the Top Endowments and Avoid Bear Markets
By way of background, the “Ivy Portfolio” shows step-by-step how to track and mimic the investment strategies of the highly successful Harvard and Yale endowment funds. Using the endowment Policy Portfolios as a guide, the authors illustrate how an investor can develop a strategic asset allocation using an ETF-based investment approach.
Faber discusses 5, 10, and 20 security portfolios that have trading signals based on long-term moving averages.
The rules for this portfolio are simple: Buy each ETF at the beginning of the month if it closed the previous month above its 10-month simple moving average. Check each month at the beginning of the month and only sell the ETF if it closed the month below its 10-month simple moving average. Keep any proceeds in cash (in other words, do not use the proceeds to purchase one of the other ETFs). Ignore any activity that occurs within the month. For example, if the ETF closes the month above its 10-month SMA and falls below its 10-month SMA on the 8th, ignore this “noise”. The positions should only be bought or sold at the beginning of the month.
To drive this point home even further Scott replicates this model for commission-free products at the major retail shops and ETF sponsors: TD Ameritrade, Vanguard, Fidelity, and Schwab.
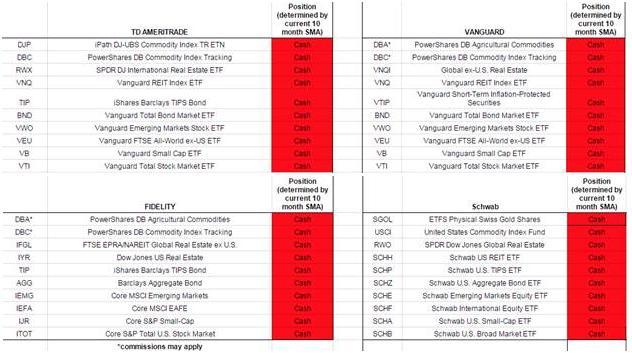
As you can see following the closing price of equities on the last day of August, the results all show the same thing – that is, there is a medium-term switch in the endowment model. While we realize this is a very rudimentary exercise it highlights three important points: 1) alongside hedge funds and retail, another marginal buyer of equities may have just walked away from the market; 2) this may prompt pension funds to re-evaluate their equity holdings as well; 3) this leaves only the sovereign wealth funds (SWF) and corporate share repurchase plans as buyers in the market. The risk is that the latter two can’t necessarily hold it up by themselves and endowments were/are a tipping point now.
The final observation to kick-off September relates to correlation and whether professionals can rely on that metric in the short-term, especially discretionary macro managers.
Sight Beyond Sight is a subscription-based newsletter published by global macro think tank Rareview Macro LLC and authored by Rareview Macro’s Founder and Managing Member Neil Azous. Cited frequently by WSJ, Bloomberg LP, Reuters, and CNBC, Azous provide investment professionals and sophisticated, self-directed investors with objective analysis and actionable ideas. Rareview Macro Twitter feed is via this link