Archives: July , 2013

WisdomTree: ETF Underlying Liquidity vs. Secondary Market Liquidity Explained (Again!)

etftrends logo imagesCourtesy of Zach Hascoe/WisdomTree Investments

We have heard it over and over: Exchange-traded funds (ETFs) are wrappers, and the true liquidity of an ETF is derived from its underlying constituents.1 While that statement is true, it does not completely explain different types of liquidity that can exist in an ETF.

Different types of ETFs can serve different purposes as exchange-traded vehicles, depending on the exposure they provide. Some ETFs are used primarily for hedging and intraday portfolio trading. These ETFs typically track major world benchmark indexes, and they trade millions of shares per day.  Other ETFs are structured more as investment vehicles and don’t typically have very high average daily trading volumes. Investors come into the products, hold their positions and eventually unwind the investment months or years down the road. While all ETFs can be held for prolonged periods or intraday, some ETFs experience more secondary market trading than others. At WisdomTree, we structure all our ETFs with liquidity screens to help provide sufficient implied liquidity (underlying liquidity), so even if the ETF has a low average daily volume in ETF terms, that does not mean the ETF is illiquid.

*MarketsMuse Editor note: Because ubiquitous trading screens often fall short in displaying actual liquidity v. what appears on the screen, institutional investors and RIAs are advised to defer to independent, “agency-only” execution firms –those who specialize in providing objective insight and the likely liquidity that exists “behind the scenes”

A recent comparison between the WisdomTree India Earnings ETF (EPI) and the WisdomTree LargeCap Dividend ETF (DLN) helps illustrate the difference between primary market and secondary market liquidity. As the industry’s first India ETF (launched in February 2008), EPI has become a popular way to gain intraday tactical exposure to India equities. For example, during the week of May 20, 2013, to May 24, 2013, EPI traded roughly $325 million of dollar trading volume on the secondary market. Yet during that week, EPI had no creation/redemption activity. There was $325 million of dollar volume traded and there were no inflows or outflows that week in EPI. That is secondary market liquidity. Investors were able to easily buy or sell EPI on the secondary market, as buy and sell orders were matched up by the broker-dealers. While new shares can be created on the primary market if demand warrants it, EPI is so widely traded by a wide variety of market participants, that often there is significant two-way trading in the ETF that happens on the exchange. At the end of the day, dealers left with inventory in EPI may decide to hold on to their positions because they are confident that two-way demand in the ETF will continue the next day. Continue reading

ETFs Test Market-Making Skills

marketsmedia logoCourtesy of Steve Marlin/MarketsMedia

With exchange-traded funds playing an increasingly important role in portfolio management, the ability to accurately price the instruments has placed a premium on market-making skills.

“ETFs are a unique breed of financial instruments,” said Chris Hempstead, director of ETF execution services at WallachBeth. “Order execution requires the ability to navigate these markets and compel liquidity providers to offer customers the most aggressive bids and offers.”

With upwards of 1,500 listed products in the U.S. alone, the secondary market for ETFs remains evolutionary, and liquidity in many ETFs is often elusive, despite the sophistication of screen-based electronic markets.

Chris Hempstead, WallachBeth Capital

“ETF wrappers provide an efficient way to gain access to an index,” Hempstead said. “But not all ETFs have sufficient depth of quotes, so you need to partner with someone who knows how to value an ETF. Even SPY, the most liquid ETF, doesn’t trade exactly at NAV [net asset value]. For less liquid ETFs, the spreads could be considerably higher.”

Sourcing liquidity at the right price for ETFs, ETNs and CEFs requires an advocate with a wide net, unhindered visibility and unencumbered market access, one whose pool of liquidity extends beyond traditional screen-based markets and the boundaries that conventional brokers are constricted to. “Because we’re product experts we are able to use both traditional and tech-savvy means to quickly and efficiently canvass a broad and diverse universe of reliable liquidity providers,” Hempstead said. Continue reading

For Value ETFs, the Bet Is on Financial Stocks: Institutional Investor Report

ii_logo_240px-wide Courtesy of Barry Whyte/II Magazine

Latest data show that most funds have weightings of more than 20 percent in financials.

If the portfolios of value-oriented ETFs are anything to go by, the best value stocks out there at the moment are in the financial sector.

The findings come from a detailed analysis of 18 value ETFs done by financial data firm Axioma on behalf of Institutional Investor.

According to the data from June 14, 2013, while virtually all of the funds share roughly similar allocations to sectors such as energy, health care, industrials and information technology, every one of the funds has made very large bets on stocks within the financial sector.

Of the 18 funds, all but one has made the financial sector its largest exposure. Only the First Trust Large-Cap Value Alphadex Fund deviates from this trend, with a slightly larger exposure to energy stocks (16.7 percent) compared to its 15.8 percent exposure to financials. For all other ETFs analyzed, the big bet is financial.

Among midcap focused funds, the bet is even greater, with each of the iShares Russell Midcap Value Index Fund, the Vanguard Midcap Value Fund and the SPDR S&P 400 Midcap Value ETF respectively placing 30.5 percent, 20.9 percent and 27.3 percent on financial stocks. The two largest single bets on the financial sector exist among the small-cap-focused funds.   For the remainder of the II Magazine report, please click here.

Managing Conflict Re: Broker-Provided Trading Systems

UBM TECH ADVANCED TRADING LOGOCourtesy of AdvancedTrading Contributor Phillipe Buhannic

Editor Note: This article is endorsed by MarketsMuse sponsor OMEX Systems, Inc.

Buy-side clients need to understand that when they trade on a broker-sponsored platform, they are paying for these systems, whether that payment comes in the form of commissions, licenses, or widened spread. Therefore, the most important thing the buy side should do is to think like a customer.

The last year’s market deterioration made things difficult for brokers, who are seeing tighter spreads, fragmented flow, smaller trade sizes, and compressed commissions. Brokers now face the most difficult operating environment in recent memory, with decreased market liquidity, increased message traffic and lower order volumes from clients.

Brokers also find themselves in an adverse situation, having over-invested in a number of areas, including their trading infrastructure, their capability to generate algorithms and their ability to process trades. Most broker’s capabilities vastly surpass the current needs of their clients.

From Bad To Worse
And just when you thought that things could not get any worse for brokers, they are now increasingly subject to regulation seeking to promote transparency. Brokers also have to deal with plan sponsors who need to justify more effectiveness in trade handling, and, more generally a buy side that wants to clear up the inherent conflict of interest of broker-sponsored platforms.

As broker-sponsored platforms face an uncertain future, sophisticated buy-side firms have to answer difficult questions about how they manage the associated risks of trading on these platforms … and whether those risks are worth taking at all.

Although broker-sponsored platforms can be conceptually acceptable, investors need to protect themselves against the risks that these systems could potentially generate, such as significant market impact, limitation of transparency and higher, undisclosed, transaction costs.

Top 10 Buy Side Concerns
Here are the the top 10 issues every buy-side trader needs to be mindful of to ensure efficient and effective trading on their broker-sponsored platforms: Continue reading

ETF Investors Step Up Their Short Game in Junk Bonds

wsj_printCourtesy of Chris Dietrich, WSJ

After last month’s bond market selloff, many investors are hunting for strategies that can still provide high yields but won’t get hurt by rising interest rates.

Increasingly, they are turning to exchange-traded funds focused on short-term junk bonds, which promise those investors just what they are looking for.

Pacific Investment Management Co.’s Pimco 0-5 Year High Yield Corporate Bond ETF soaked up $602 million since the start of May, just as rates started to tick higher, according to IndexUniverse. The SPDR Barclays Short Term High Yield Bond ETF took in $318 million.

At the same time, investors are heading for the exits in longer-term high-yield bond funds.

The iShares iBoxx $ High Yield Corporate Bond ETF saw outflows of $1.4 billion since May. State Street Global Advisors’ SPDR Barclays High Yield Junk Bond ETF lost $1.8 billion.

Shorter-term ETFs have proved the better option during the latest bout of market duress. Both styles of junk-bond ETFs lost ground last quarter, but the short-term variety’s declines are less severe.

The Pimco 0-5 Year High Yield Corporate Bond ETF and the SPDR Short Term High Yield ETF lost less than 1%, including coupons dividends, in the second quarter, according to Morningstar. The iShares and State Street longer-duration funds, meanwhile, declined more than 2%.

And so far in 2013, the short-term funds returned more than 1%, while their counterparts are in the red.

“Shorter-term junk bonds are lower volatility, so in a downdraft there’s a lot less downside than regular junk bonds,” said Chun Wang, co-portfolio manager at Leuthold Weeden Capital Management, an investment manager based in Minneapolis. Continue reading

ETF Volatility: The Real Story Behind The [Bloomberg] Story

indexuniverseCourtesy of Dave Nadig’s July 12 column

This morning Bloomberg published a story titled “ETF Simplicity Betrayed by Volatility in Market Selloff.”

In the article, the authors contend that they’ve run the numbers, and that ETFs are just flat-out more volatile than mutual funds. Here’s the lead:

“Share prices for the 10 largest diversified emerging-market ETFs on average were 42.6 percent more volatile than their underlying indexes from May 22 to June 24.”

Let’s break down what they could possibly mean here, and let’s start with a few baselines.

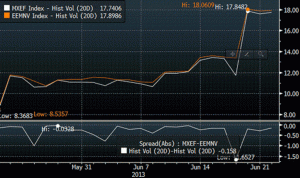
While the article claims it’s not addressing the issue of premiums and discounts—that is, how far off fair value a given ETF closes in market trading versus its underlying index—it’s fairly clear that’s not the case. If it were, then the following chart wouldn’t make sense.

This is a rolling look at the 20-day historical volatility of the iShares MSCI Emerging Markets ETF (NYSEArca: EEM) and the actual index it tracks, over the period in question. I’m looking here at the actual NAV, and as you’d expect, they track extremely closely:

1---EEM-VOL

The bottom line looks at the difference, and you might ask: “Well, why is there any difference at all?”

Continue reading

Stock ‘fear gauge’ flawed, Equity Trading Chief says


Excerpts courtesy of Simon Jessup, Reuters  

MarketsMuse Editor Note: Yes, the headline and the article are both elementary observations for many; yet there remain many others (including investment managers) who misunderstand the meaning of VIXreuters


Investors seeking to predict the magnitude of share price moves at times of market flux may get a faulty steer from a closely watched “fear gauge”, one of investment banking’s top equity traders has warned.

Citi’s Mike Pringle, global head of equity trading at the third-biggest U.S. bank, told Reuters that the VIX volatility index , is now as much a traded asset as it is a guide to investors seeking protection from losses.

The VIX reflects Standard & Poor’s 500 .SPX options prices and, therefore, expectations of future market moves. The idea is that as people become fearful of losing their money, they are more willing to buy a put option as protection.

At the moment, it remains at very low levels.

“A big mistake the market makes is looking at the VIX as an indicator of stock market risk. Why? Because it’s an asset class and it’s more traded for yield than protection,” Pringle said. “It’s still relevant in extremes, but not in a normal functioning market,” Pringle said.

While persuading others of the VIX’s flaws is not easy, Pringle said Citi’s handling of risk management in equities had been restructured accordingly.

Rather than relying solely on the VIX, Citi traders and clients can turn to their “Central Risk Desk”– through which a large proportion of its trades are routed.

The computer programs that underpin the desk’s activities assess around 60 measures of market stress and timing – from global risk arbitrage spreads to dividends to repo rates – to get a better read on sentiment, behavior and deal timing.

Looked through this prism, there is greater risk currently in global markets than the narrower VIX is suggesting.

For the entire article from Reuters, please click here

Trading Systems Vendor to ETF and Options Trading Firms Ups Ante

wsj logo

New York, NY, July 10–OMEX Systems, LLC (“OMEX”), the provider of broker-neutral DMA and OEMS trading systems for broker-dealers and buy-side investment firms active in stocks, options and futures announced the addition of 2 more trading technology veterans to the firm’s New York office, bringing the 5-year old company’s total staff of sales, client support and software programming to 22 professionals.

Joining the firm as Head of Sales is Antonio Panos, the former co-founder and sales director for Mixit Systems, Inc., the sell-side equities trading system vendor which first came to market in 2002 and was acquired in 2011 for $20 million by UK-based futures market vendor Patsystems Plc.  In addition to Mr. Panos, Matthew Weiss, a 15-year trading technology veteran, has been appointed Head of Client Support for OMEX. Mr. Weiss was most recently VP of Buyside Sales for Blockcross ATS; he previously held senior sales management roles for industry icons Lava Trading (a Citigroup subsidiary), NYSE Group’s Archipelago Holdings and MB Trading.

Given the scarcity of truly comprehensive and cost-efficient broker-neutral DMA/OEMS platforms, during the past 4 years New York-based OMEX has morphed from an “under-the-radar technology boutique” to a sought-after solutions provider for both sell-side and buyside firms. The multi-asset OMEX platform is designed for firms that require a full suite of order execution management, risk controls, commission management features, multi-custodian trade allocation and straight-thru processing in one, easily-customized platform; features that are typically only attainable by mashing up disparate software products from multiple, premium-priced vendors. Continue reading

ETFs Gaining Traction Among Canadian Institutional Investors

etftrends logo imagesJuly 8th 2013 at 3:15pm by Tom Lydon

Mirroring the growing sentiment in the U.S., institutional investors in Canada are also embracing exchange traded funds and are expecting to increase allocations to the investment vehicle in the years ahead.

According to a Greenwich Associates study, titled Versatility Fuels ETF Growth in Canadian Institutional Portfolios, the share of Canadian institutional funds using ETFs increased to 12% in 2012 from 11% in 2011. Looking at institutional funds with over $1 billion in assets under managements, 21% of larger institutional funds utilized ETFs in 2012, compared to 15% in 2011. [More Institutional Investors Seen Using ETFs]

“Given the simplicity and flexibility of exchange traded funds, we’re not surprised that institutional investors are turning to ETFs more regularly to achieve their investment goals,” Greg Walker, Managing Director, Head of iShares Institutional Business, BlackRock Canada, said in a press release. “As indicated in the Greenwich survey, institutional use of ETFs is on the rise in Canada as institutional funds, investment managers and insurance companies discover new functions for these products within their investment portfolios.”

The study found that there are two reasons to increased use among institutional investors:

Continue reading

Bond ETFs 101: Understanding the Meaning of Liquidity, Arbitraging iNav

   Courtesy of Dave Nadigindexuniverse

MarketsMuse Editor Note: For those unfamiliar with the logistics of buying and selling corporate bonds in the secondary market,  and particularly for those not fluent in why/how corporate bond ETFs are priced and trade, the following column courtesy of IndexUniverse’s Dave Nadig provides a good primer. Important take-away: if an executing broker attributes a poor execution to “not enough liquidity”, we respectfully suggest that you are likely using the wrong broker.

Apparently the last week around here has been iNAV week. With Matt calling for their banishment, me agreeing with him (much to my dismay) and Ugo Egbunike calling us both idiots.

And Ugo’s points are all valid. INAV can be a fantastic tool, and one which smaller investors can use to make money. The action in this week’s bond market is a fantastic case in point.

Now, bond pricing is a tricky thing. As Rick Ferri pointed out today in an excellent blog over at Forbes, when the liquidity of the bond market starts getting shaky, bond ETFs can trade well below their fair value. He uses that fact as reason to suggest avoiding bond ETFs. I see it as a trading opportunity.

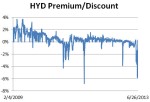
Let’s pick a simple example I’ve been following all week: the Market Vectors High Yield Municipal Bond ETF (NYSEArca: HYD).

I’m not a bond master; I won’t tell you whether this week was a good or bad time to buy high-yield munis. But what I can tell you is that as a rule, it more often trades at a premium than a discount:1PoorMansArb

For the entire article, please visit IU’s site by clicking here

An Obamacare ETF Winner

indexuniverseCourtesy of Tom Lydon

The Patient Protection and Affordable Care Act, or Obamacare as it is widely known, is this country’s most sweeping health care legislation in multiple generations. It has also been highly controversial, but political partisanship aside, select stocks and ETFs have benefited from President Obama’s efforts to increase access and affordability to healthcare while holding insurance companies more accountable.

The iShares U.S. Healthcare Providers ETF (NYSEArca: IHF) is one such fund. Year-to-date, IHF is up 22.8% and the ETF has surged 34.3% in the past year. Those performances have come after many analysts originally had less-than-encouraging outlooks for the health care sector in a post-Obamacare world. IHF and its 47-stock roster have also remained sturdy in the face of the fiscal cliff and sequestration debates. [ETF Spotlight: Affordable Care Act]

With the U.S. moving forward with the Affordable Care Act, millions of new clients are expected to flow into the health care sector. That portends potentially rosy future outlooks for IHF constituents such as Dow component UnitedHealth (NYSE: UNH) and Express Scripts (NasdaqGS: ESRX). As a result, IHF has jumped almost 23% since Election Day 2012. [ETFs for Obama’s Second Term]

Despite IHF’s obvious success, the ETF’s gains, fueled by its components, have caught some health care sector analysts and observers by surprise. “In some ways, the sector’s good fortune seems counterintuitive: All sectors of the industry are under stress, thanks to various provisions of the federal Affordable Care Act that seek to wrestle with health costs, hospital performance and health insurer profit margins. Hospital and prescription use is flattening,” reports Bill Tolland for the Pittsburgh Post-Gazette.   For the remainder of the article, please visit IndexUniverse.com